

- Tron price remains on a positive momentum with the help of overall market conditions on Tuesday’s trading session
- Tron price today is $0.0285 with a gain of 3.84% in the last 24 hours and 1.73% up from the previous week
- TRX/BTC pair is performing negative with an overall loss of 6.19% on Tuesday’s trading session (0.00000090)
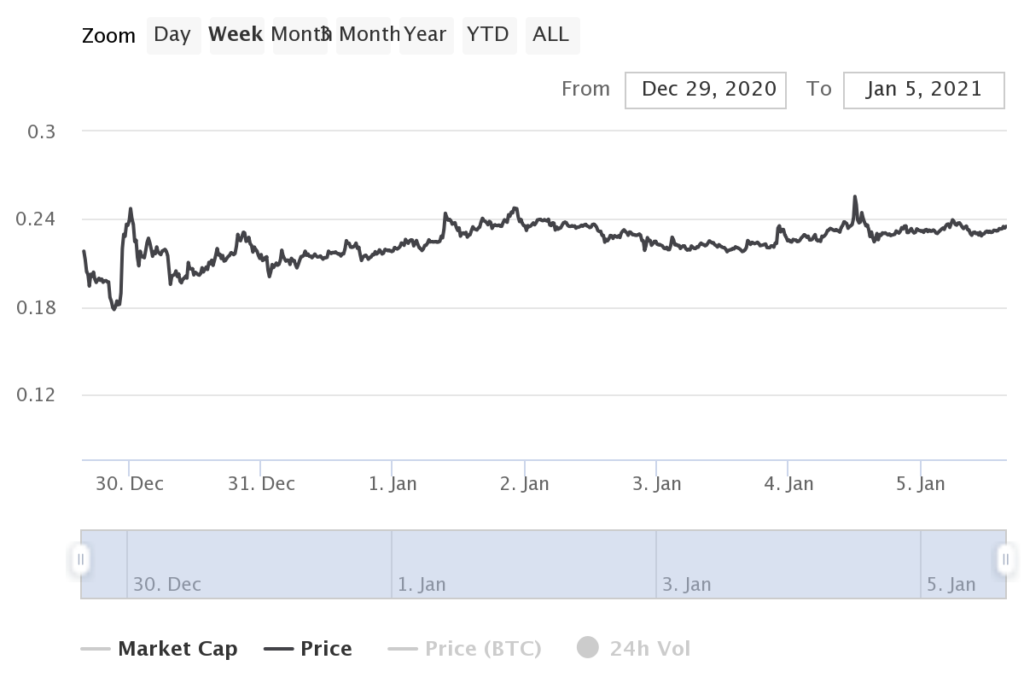
Source: Coinmarketcap
On the weekly chart, Tron was in a positive trend with modest price corrections in between. The price went down to $0.0267 on Jan 3, 2021 and recovered back up to $0.0321 on Jan 4, 2021. With an overall return of 18.36% to its investors within a day.


Tron Technical Levels Can Face A Downtrend For Next Upcoming Trading Sessions
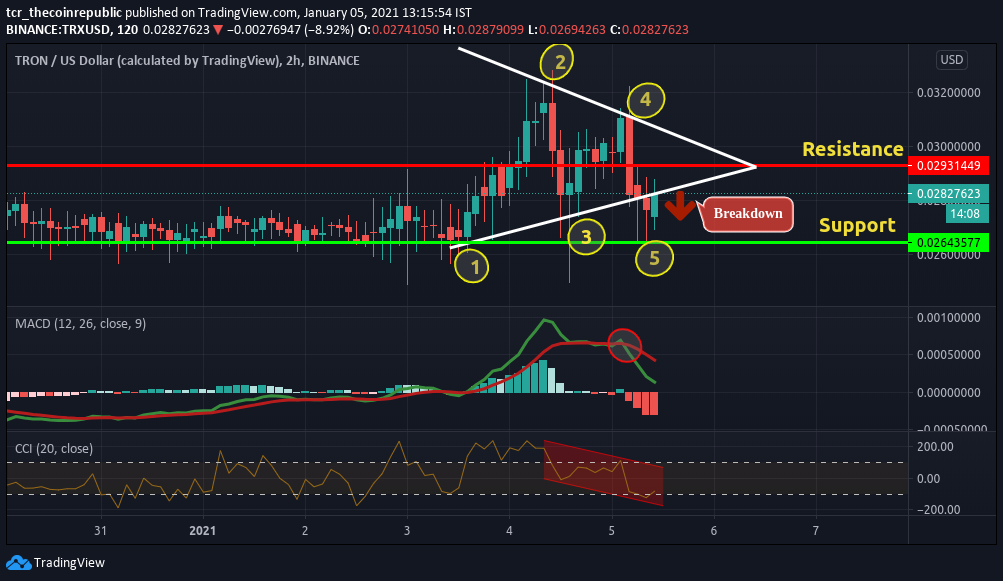
Source: TradingView
The weekly technical chart of TRX highlights a positive trend built by the coin with modest price corrections in between. A sudden spike in price movements can be seen from Jan 3, 2021. A symmetrical triangle continuation pattern is formed on Tuesday’s trading session. TRX successfully broke down that pattern for a downward movement with the resistance zone placed at $0.0293 and the following support zone of $0.0264.
If we dive into the weekly chart’s 30-minute time frame, A Belt Hold Bearish Candle is formed, which indicates a selling signal in the coin.
The Moving Average Convergence Divergence (MACD) had a crossover signal line indicating a selling signal in the coin. The histogram also started to form a few massive red bars after the crossover.
Meanwhile, the Commodity Channel Index (CCI) with a value of -72.00 indicates that the coin is in a downtrend and in an oversold region. It formed a descending parallel channel from 189.00 to -72.00
Conclusion
Tron (TRX) is currently struggling between its resistance and support zone with a positive trend from last week, and had a breakdown from the symmetrical triangle continuation pattern and can move in downtrend for the next few trading sessions.
Resistance: $0.0293
Support: $0.0264


