

- OMG price action bounced back from $9.10 to $10.30 on Saturday’s trading session
- The 24-hour volume in OMG is at $1,166,444,747 with a 37.27% increase
- The OMG/BTC pair was trading at 0.0001704 BTC with a gain of 2.43%
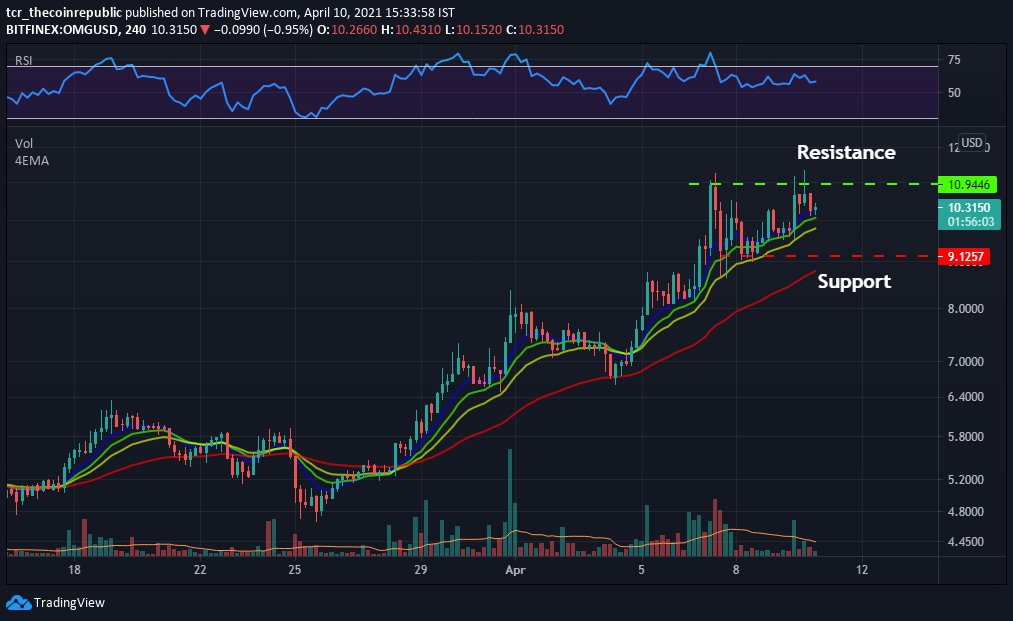
The 4-hour technical chart of OMG price action forecasts a positive trend. According to pivot points, OMG’s critical support level is placed at $9.10. Whereas if it moves up, the key resistance level to watch is $10.95. While diving into the weekly chart of a 4-hour time-frame, it completes a bearish engulfing candlestick pattern representing bearish reversal with high reliability.
EMA- (8,13,21,55) acts as another strong support in the coin. EMA-8 (blue) is above EMA-13 (green), which projects a positive trend. The price is sustaining above 8-EMA. Investors may perceive positive crossover in the EMA, and the price will also follow the positive trend.


RSI indicator (BULLISH), with a value of 58.45, indicates a buy signal in the coin. Moreover, Investors can see a flat slope in the index, and it may surge in future trading sessions.
The volume of (27.78K) represents a low buying volume which is below the Volume MA (94.98K) of 20-days. High buying pressure is required in OMG to drive its price to higher levels.
Buying Volume is Required In OMG
OMG price traded at $10.30 with a gain of 6.80% in the last 24-hour and 40.87% up in the weekly time-frame. Furthermore, OMG bounced back from the support of $9.10. In contrast, the market capitalization stands at $1.44 billion. Technically, investors can perceive a positive crossover in EMA, and the price is above the 8-EMA. RSI index showcases a flat slope. Moreover, the price movement can exceed the resistance of $10.95 in future trading sessions.
Resistance: $10.95
Support: $9.10


