

- BTT price plunged from $0.01318 to $0.00739 on Thursday’s trading session
- The 24-hour volume in BTT is at $867,026,088 with a 39.69% decrease
- The BTT/BTC pair was trading at 0.0000001372 BTC with a loss of 4.29%
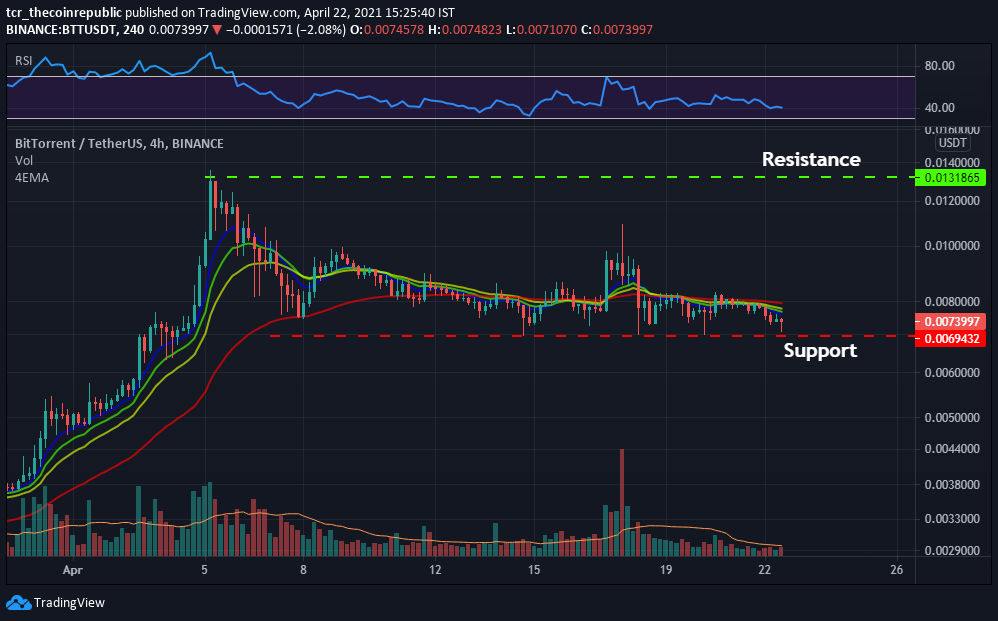
The 4-hour technical chart of the BTT price forecasts a downtrend. According to pivot points, BTT’s critical support level is placed at $0.00694. Whereas if it moves up, the key resistance level to watch is $0.01318. While diving into the monthly chart of a 4-hour time frame, it completes a bullish pin bar candlestick pattern representing bullish reversal with medium reliability.
EMA- (8,13,21,55) acts as another strong support in the coin. EMA-8 (blue) had a negative crossover below EMA-13 & 21 (green, yellow), which projects a negative trend. The price is also below the EMA-55 (red). Investors may perceive a negative crossover in the EMA, and the price will follow the negative trend.


RSI indicator (BEARISH), with a value of 40.26, indicates a sell signal in the coin. Moreover, Investors can see a downward slope in the index, which may plunge in future trading sessions.
The volume of (5.65B) is below the Volume MA (6.45B) of 20-days. No huge red volume bar can be observed above volume ma of 20-days to pull down the price. High buying pressure is required in BitTorrent to drive its price to higher levels.
BTT Price Action Requires Buying Surge
BTT price traded at $0.00739 with a loss of 7.28% in the last 24-hour. Furthermore, BTT price is in a continuous downtrend and testing the support of $0.00694. In contrast, the market capitalization stands at $4.76 billion. Technically, investors can perceive a negative crossover in the EMA, and the price is below the 55-EMA. RSI index showcases a downward slope. Moreover, the price movement can be towards the support of $0.00694 in future trading sessions.
Resistance: $0.01318
Support: $0.00694


