

- Vechain price after sharp profit-taking now indicates a sign of bottom out, as trying to recover over the monthly chart
- Currently, the coin is sustaining above all the critical moving averages of 20,50,100 and 200-Day with good support from volume
- The pair of VET/BTC made a similar kind of structure, currently standing at 0.000003597 BTC with an intraday drop of -7.46%
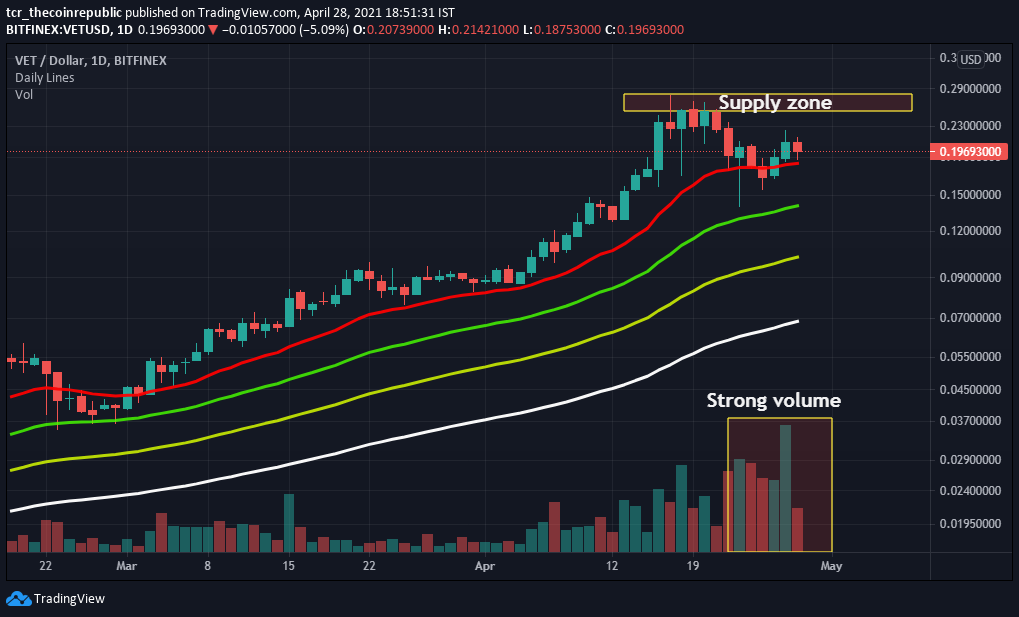
The Vechain price correction now seems to be over, as the price recovers sharply from the low of $0.1330 due to strong buyers sentiment. Meanwhile, the coin is now successfully placed above significant moving averages of 20, 50, 100, and 200-Day. The coin is currently consolidating after a two days rally, and the volume also indicates the strong momentum. Meanwhile, support on the lower level is situated at $0.1600 and $0.1400. Likewise, the resistance on the higher side is located at $0.2400 and $0.2800. While the coin is slowly reaching towards the significant supply zone if it suppresses, then a strong momentum till $0.3000 and $0.3400.

Vechain price over the weekly chart at a 4-hour time frame indicates some relief, forming a stable chart pattern. While we can see the consolidation in the shorter term and volume over the chart is also good. In the last 24-hours volume jumped nearly 12%, standing at $3,010,248,559. Presently VET price is trading at the level of $0.1967 with an intraday loss of +8.15%; whereas, the total market capitalization presents at 13th rank stands at $12,719,254,322 with an intraday loss of -8.12%.


Relative Strength Index (NEUTRAL) indicates neutral or sideways momentum while trading at 49.62. However, moving flat with no significant movement.
Moving Average Convergence Divergence (NEUTRAL) currently indicates a sideways momentum on the daily chart, as it is trading with the significance of the buyer’s signal line (green) over the seller’s line (red).
Support levels: $0.1600 and $0.1400
Resistance levels: $0.2400 and $0.2800


