

- LSK Token falls more than 25% within 48 hours and projects a further downtrend.
- The intraday selling volume is on the rise in coin price.
- The LSK/BTC pair trades at 0.00009554 BTC, with an intraday rise of +8.12%.
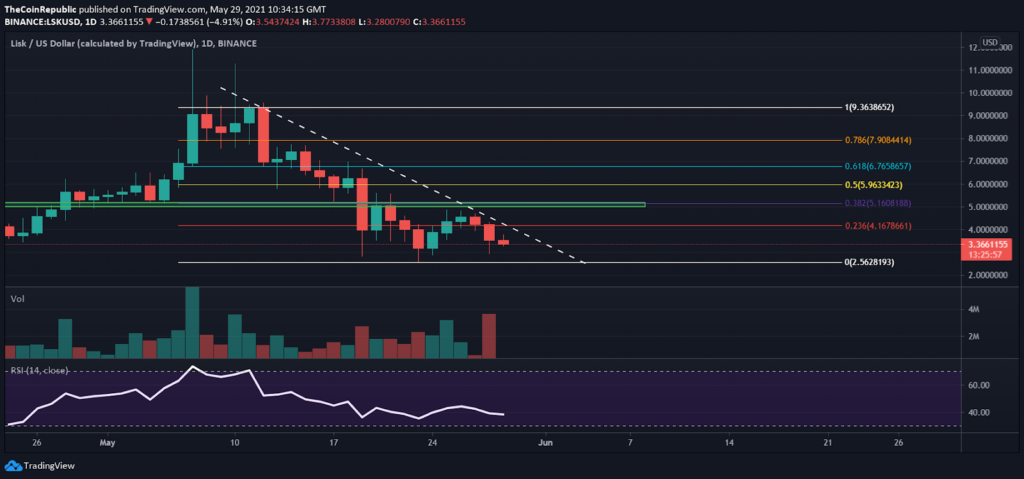
LSK Token continues to trade under a downtrend with increasing intraday selling volume. The coin price did manage to rise 65% in the last short term uptrend. This uptrend brought hope among investors, but the crypto asset failed to sustain the recovery mode and continues to fall back to the support level.
The coin price rests at 50 EMA in the weekly timeframe. Breach of this EMA could result in another sizable dumping phase for LSK coin price. Presently, LSK trades at $3.32 with an intraday gain of 6.6%. The coin price faced a fall in the intraday volume of 28%. The coin ranks at number 113 as per the market cap.


Is The Downfall Of The LSK Token Inevitable?
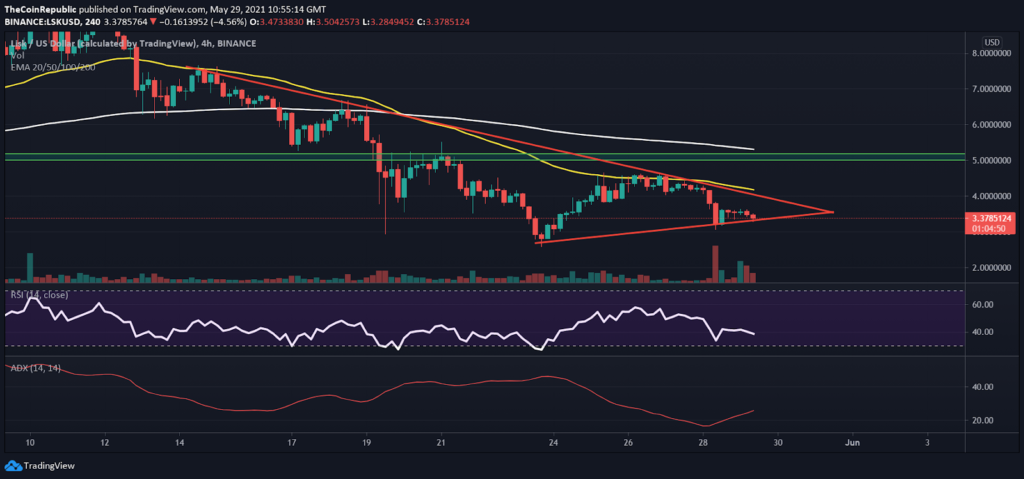
LSK Token price resonates under a symmetrical triangle in the 4-hour timeframe. The coin price is bottling up under the pattern, and a breakout might occur soon. After the triangle breaks out, the direction of the price is projected downside by the technical indicators while the price action burns hope for the bulls. The support level of $2.78 and $2.11 hold below the triangle. On the other hand, the resistance zone above the pattern between $5-$5.15 remains an obstacle for the LISK coin price.
The recent death cross in the 4-hour timeframe still influences the trend as the price fails to close above the 50 EMA. In the bigger picture of daily time frame, the coin price struggles below the 200 EMA and manages to sustain for now.
The RSI Indicator (bearish) implies bearishness in the price chart as the RSI line dips and preps to fall back under the oversold zone.
The ADX Indicator indicates a gain in trend momentum as the price continues to fall, forecasting the arrival of a strong downtrend.
Conclusion- The coin price trades inside a symmetrical pattern but the overall bearishness in the technical chart of LSK Token indicates a fall soon. However, an upside breakout will face opposition from the 50 EMA and the zone near $5. Investors must wait till the fruition of the pattern.
Resistance – the zone between $5-$5.15 and 50 EMA
Support – $2.78 and $2.11


