

- Bitcoin cash price is trading near the vital moving average (MA) of 200-Day and is trying to hold it
- The coin is significantly facing selling pressure or downtrend from the past few trading sessions and now reaches near the make or break levels of 200-DMA
- The pair of BCH/BTC is flat at 0.01855 BTC with an intraday gain of +0.18%, and the pair of BCH/ETH is trading at 0.2785 ETH with an intraday drop of -0.94%
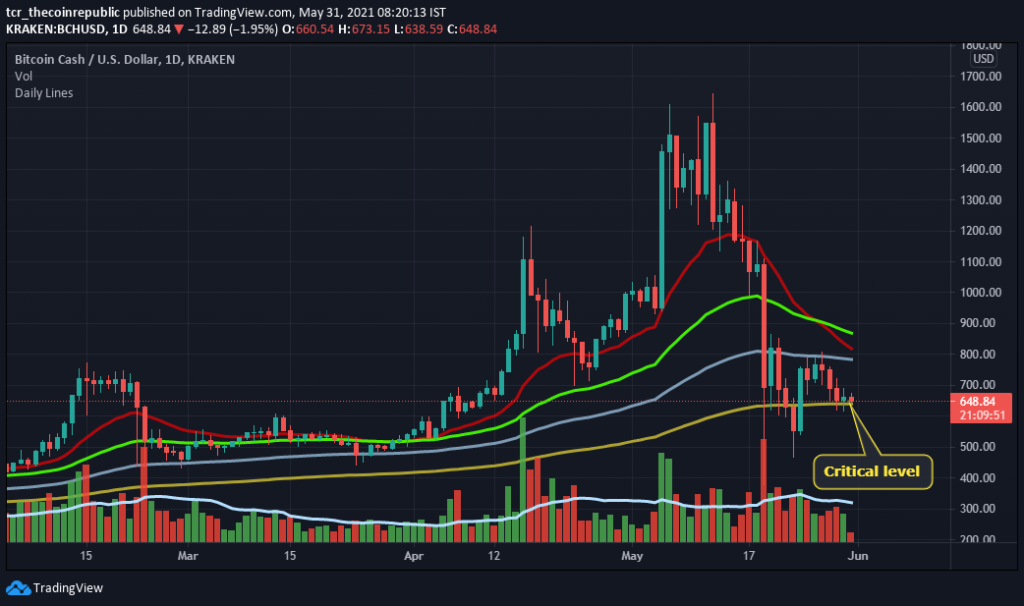
Bitcoin cash over the monthly chart is trading near the crucial level or support of the 200-Day moving average (DMA). At the same time, bulls have to maintain the coin above 200-DMA and while volume also needs to improve, which falls below the average line. Moreover, the coin falls below 20, 50, and 100-DMA while holding 200-DMA.
Support on the lower side is at $550 and $460; likewise, resistance on the higher side is $870 and $1080. However, the coin is facing multiple rejections of 100-DMA and continuously favouring bears in the short term. One can expect a good pullback if the coin manages to sustain above 100-DMA.


Bitcoin Cash Trading Sideways at 4-Hours Chart
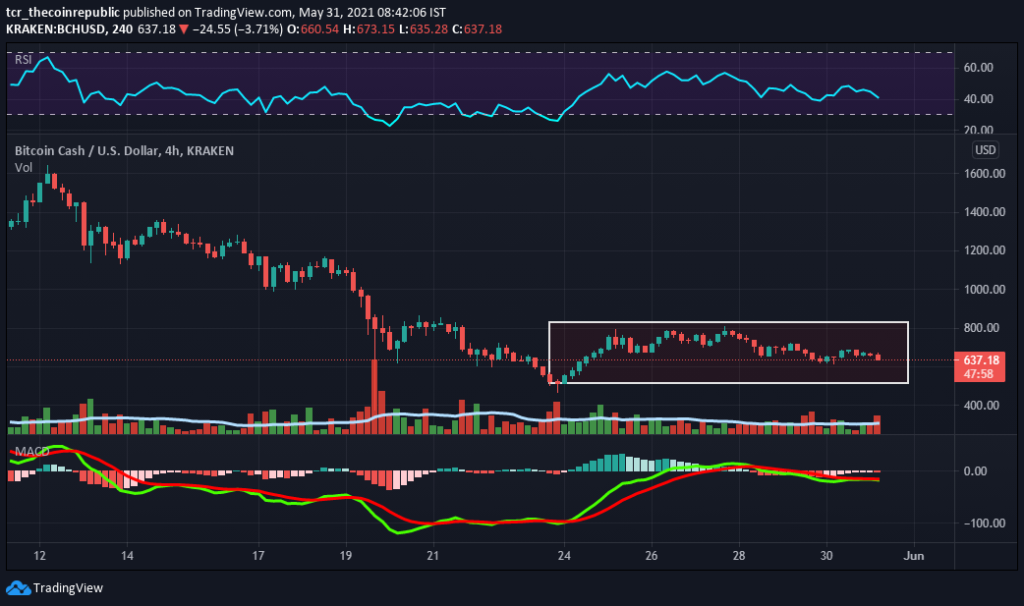
The weekly chart of Bitcoin cash is reflecting sideways or consolidating trends from the past week. Whereas the technical parameters are highlighting no significant momentum, and volume is also average. The range-bound trade is observed between $820 to $510 as highs and lows, respectively. Currently, the coin is trading at $637 with an intraday loss of -1.67%, and the volume to market cap ratio stands at 0.2004. At the current value, Bitcoin cash was the 12th largest cryptocurrency with a total market capitalization of $12,034,096,580.
Relative Strength Index (NEUTRAL): Bitcoin cash RSI is presently projecting sideways or caution momentum over the weekly chart.
Moving Average Convergence Divergence (NEUTRAL) currently indicates a sideways trend on the daily chart. The buyer’s signal line (green) and the seller’s line (red) are overlapping.
Support levels: $550 and $460
Resistance levels: $870 and $1080.


