

- Chiliz coin is trying to hold major support of 200-day moving averages under the weak market sentiment.
- The token is trading near the significant moving average of 200-Day and now trying to recover from lows with a good volume activity.
- The pair of CHZ/BTC is trading at 0.000008141 BTC with a minor intraday loss of -1.02%; while the ratio of CHZ/ETH is trading in green at 0.000133 ETH and up by +0.98% in the last 24-hours
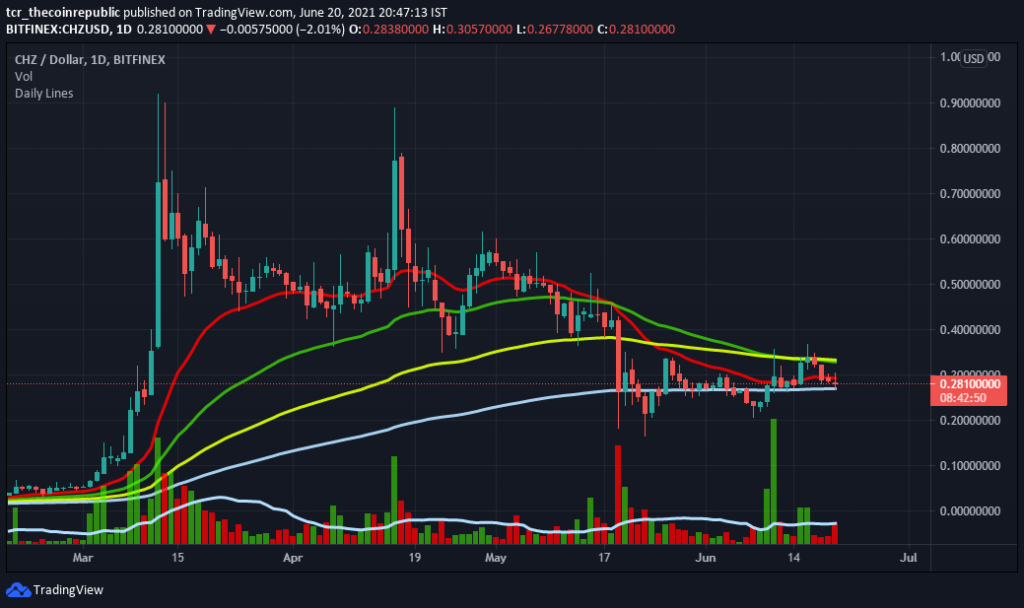
Chiliz coin is near the strong support of 200-Day moving averages, and the volume fraction is also increasing near the support zone. The coin is presently trading under the tight, narrow range of 200 to 100-DMA, and either side breakout will create a good momentum.
Likewise, if the digital asset sustains above the 20, 50, and 100-DMA will boost the bull’s confidence and create a good growth of investors. Similarly, if the token plunges below 200-day, moving averages will fuel Bears to overpower for a long time. Support on the lower side is at $0.21 and $0.16, whereas the higher side’s resistance is at $0.36 and $0.57.


Chiliz Coin Over Weekly Chart is Trying to Recover
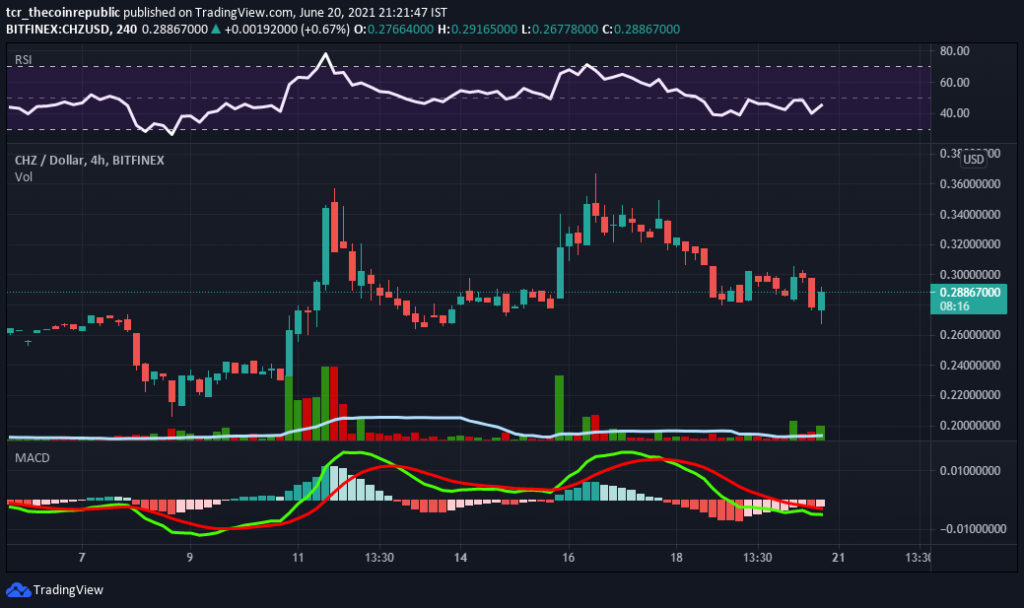
Chiliz coin over the weekly chart is now trying to recover and is trying to build a bullish engulfing candle with average volume. Moreover, this week’s digital asset is on bullish momentum and witnessed a sharp selloff from the higher levels. Likewise, the technical parameters are also indicating the sign of recovery in upcoming trading sessions. Presently, the coin is trading at $0.28 with an intraday loss of +4.76%, and the volume/market cap ratio stands at 0.2629.
Relative Strength Index (BULLISH): Chiliz coin is presently projecting a bullish trend over the weekly chart as now trying to recover from lower levels.
Moving Average Convergence Divergence (BEARISH) currently indicates a bearish trend on the daily chart. The buyer’s signal line (green) is trading under pressure, and the seller’s line (red) is more significant.
Support levels: $0.21 and $0.16
Resistance levels: $0.36 and $0.57.


