

- MANA coin price drops below the 200-MA of $0.63 on intraday session
- MANA/BTC pair is trading positive by 4.3% at 0.00001616 BTC
- The 24-hour trading volume in MANA is $51.483 Million
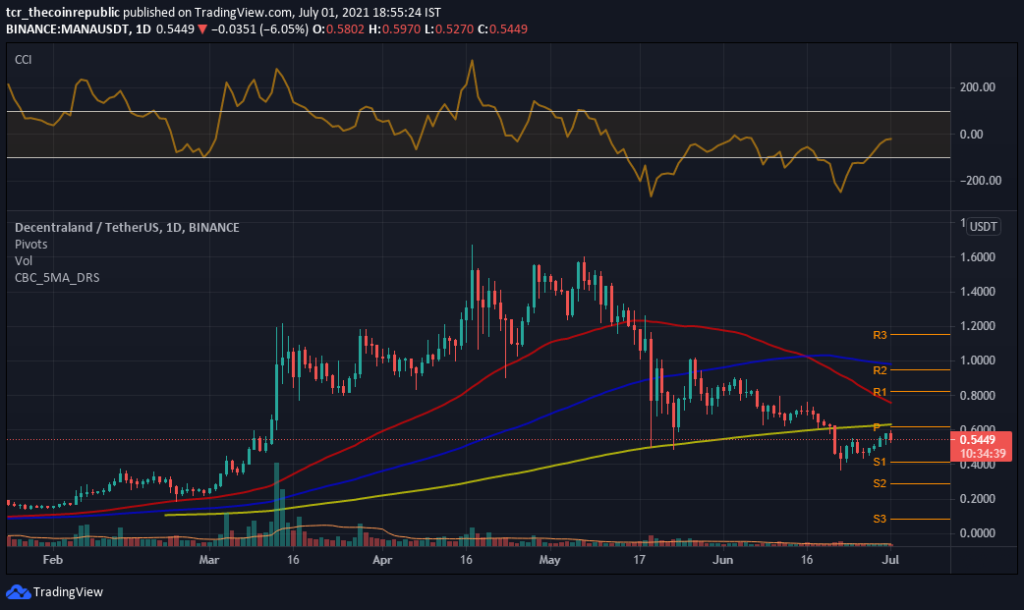
The daily technical chart of the MANA coin predicts a bearish movement. Based on the pivot point, the key support level for MANA is $0.40. However, if it moves higher, the key resistance to be aware of is $0.62. Besides, the chart also determines a bearish engulfing candle, showing a downward trend with high reliability.
Moving average (MA) formed of 50,100,200-MA can be substantial support for currency price changes. In addition, investors can observe that the price is below the yellow line, ensuring a downward trend in MANA until the price stays below the MA-200.


CCI indicator gave a (neutral) signal with -20, projecting a flat trend in the coin. As a result, investors may observe a flat slope in the index. It may plunge in future trading sessions.
Volume of (11.20M) is displayed close to the 20-day MA (13.99M). It represents high selling pressure that pushes the price level to drop to a lower area. Investors may also observe a decline in volume on the chart, which indicates that a big move is expected soon.
The Decentraland (MANA) Coin May Drop 10% From The CMP
The price of the MANA Coin is $0.54, with a daily gain of 1.6% and a weekly surge of 8.4%. In addition, the market value is $725 Million. Technically, the price shows weakness and is below 200-MA. CCI shows a sell signal. The volume is around 20 MA. In addition, the price may drop in future trading sessions.
Resistance: $0.62
Support: $0.40


