

- The coin is trading at $0.7164 around 0.15% up from the previous level
- The coin is trading in symmetrical triangle which is very near to breakout
- The coin is trading 0.00002067 BTC around 0.66% up 0.0003289 ETH around 0.95% up with respect to bitcoin and ethereum
MANA is a virtual reality platform which is based on ethereum. The coin was launched in 2018 and the founder is Ariel Meilich and Esteban Ordano. The coin has a market capitalization of $1,579,877,031and circulating supply of 1.69B MANA. The coin was showing an increasing bullish volume from the last few days but as the coin is trading near the upper bound of the pattern there is a drop in the volume. The last 24hrs volume is $293,767,264 around16.39% down from the previous levels
CHARTS ANALYSIS
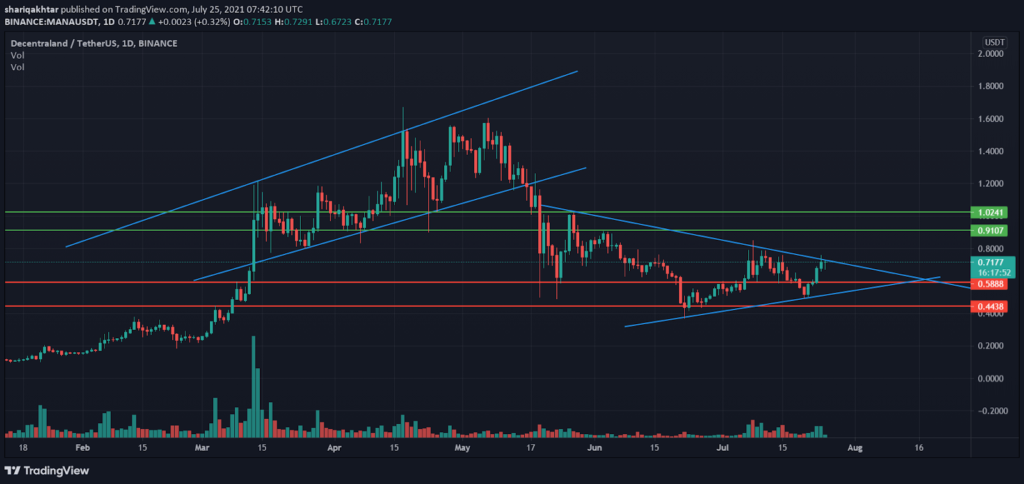
According to the chart analysis we find out that the coin is trading in channel and achieved an all time high of $1.6700 while trading in channel. The coin fell from the all-time high and reached its major support area. Currently the coin is trading in a symmetrical pattern at the upper bound of the triangle. If the coin fell from there then it would go all the way to its lower bound. Chances of breakout from the pattern is not that much as the volume decreases. If the coin is able to gain volume then we can see breakout from the pattern.


INDICATOR ANALYSIS
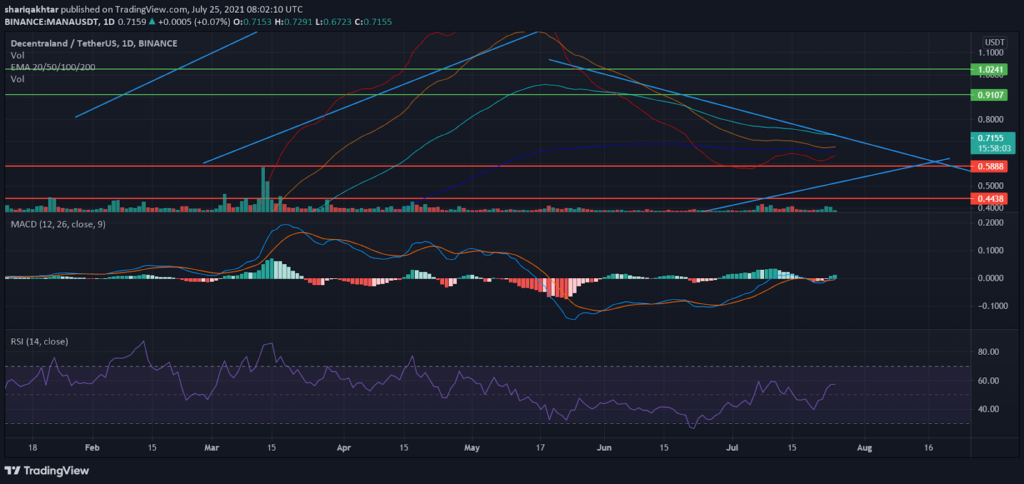
According to the indicator analysis we find out that the coin is trading above 20,50,200 EMA. the coin is facing rejection form 100 EMA. 20 ,50 EMA showing buying interest in the coin
RSI is trading neutral at 57.96. A V shaped recovery is seen in RSI with no sign of any divergence in the coin.
In MACD we see that the MACD line is above the signal line which indicates bullishness for the coin. The increasing bullish histograms indicates the increasing bullish momentum in the coin
MAJOR SUPPORT AND RESISTANCE FOR THE COIN IS
S1= $0.588 AND S2= $ 0.443
R1= $0.917 AND S3= $ 1.024


