

- MANA coin price action consolidates above the $0.68 pivot point during the intraday trading session.
- The 24-hour trading volume is at $118 million.
- MANA/BTC pair is trading positive by 1.9% at 0.00001752 BTC.
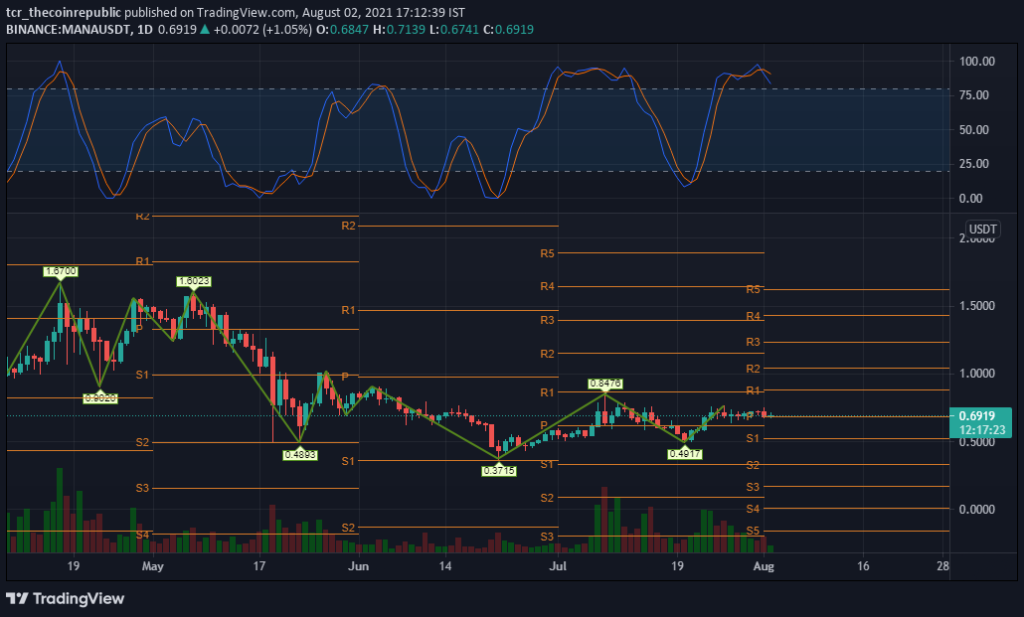
The daily technical chart of MANA coin displays a downtrend. According to the pivot levels, the primary support level is $0.52. On the other side, if it rushes up, the resistance level to follow is $0.88. Although the chart forms a Doji star candlestick pattern within the day, it is predicted that the price may remain sideways with medium reliability.
The Zig-Zag framed a top of $1.67 on 17 April. After that, investors can notice a massive correction of 78%, all the way low to $0.37. Now price levels are back around the range of $0.70 this week.


The volume of (11.37M) is below the MA of 20-days (43.14M). As a result, buying pressure is low in MANA, causing its price to remain above the pivot zone. Investors may also mark that the volume bars on the chart are declining, which intimates that notable volatility is expected in the upcoming trading session.
The Stochastic RSI (overbought) with a value of K-83 D-90 displays a sell signal in the coin. Investors may observe a declining slope and a negative intersection in the index. It may dwell in neutral territory for future trading sessions.
Decentraland (MANA) Coin Oscillators are Overbought, Prices May Correct
MANA coin price is $0.69, with a daily loss of 2.9% and a weekly loss of 2.9%. In addition, the price is consolidating above the $0.68 key region. The Stochastic RSI indicator shows a sell signal at the overbought region, and the traders have guided low buying pressure. Technically, the price shows signs of neutrality and remains sideways. Therefore, as with overall market sentiment, the trend remains bearish.
Resistance Level: $0.88
Support Level: $0.55


