

- SUSHI coin is in an uptrend of 6.8% during the intraday trading session.
- The 24-hour trading volume is at $791 million.
- SUSHI/BTC pair is trading positive by 9.9% at 0.00028554 BTC.
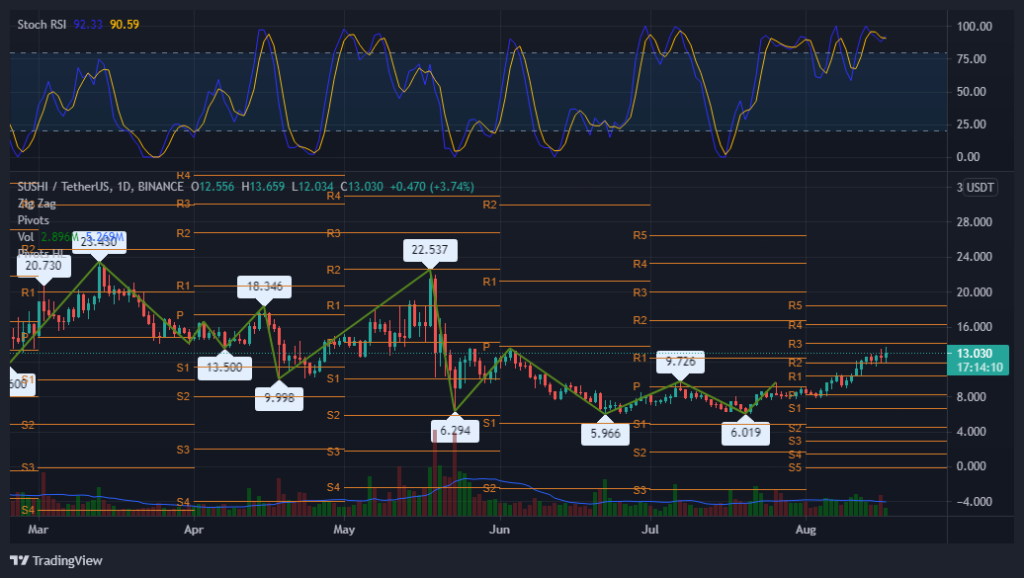
The daily technical chart of the SUSHI coin displays an upward trend. According to the pivot levels, the primary support level is $10.40. On the other side, if it rushes up, the resistance level to follow is $16.30. Although the chart forms a spinning top candlestick pattern within the day, it is predicted that the price may remain sideways with high reliability.
The Zig-Zag framed a top of $22.53 on May 18. After that, investors can notice a massive correction of 74%, all the way low to $5.96. Now price levels are back around the range of $10 this week.


The volume of (2.927M) is below the MA of 20-days (5.271M). As a result, the volume is moderate and keeps on increasing, resulting in its price moving around the resistance zone. Investors may also mark that the volume bars on the chart are declining, which intimates that notable volatility is expected in the upcoming trading session.
The Stochastic RSI (bullish) with a value of K-90 D-91 presents a buy signal in the coin. Moreover, investors may observe a declining slant and a negative crossover in the index. It may remain in positive territory for future trading sessions.
Sushiswap (SUSHI) Coin Trading Volume Increases
The price of sushicoin today is US$13.12, and the 24-hour transaction volume is US$791,505,048. The price of SUSHI has increased by 6.8% in the past 24 hours. The circulation of SUSHI coins is 190 million, with a total of 232 million. The Stochastic RSI indicator shows a buy signal, and the traders have guided moderate volume. Technically, the price moves around the resistance and remains in an uptrend. Therefore, as with overall market sentiment, the trend remains bullish.
Resistance Level: $16.30
Support Level: $10.40


