

- IOST crypto is in an uptrend at 7.8% during the intraday trading session.
- The 24-hour trading volume is at $392 million.
- IOST/BTC pair is trading positive by 5.5% at 0.00000081 BTC.
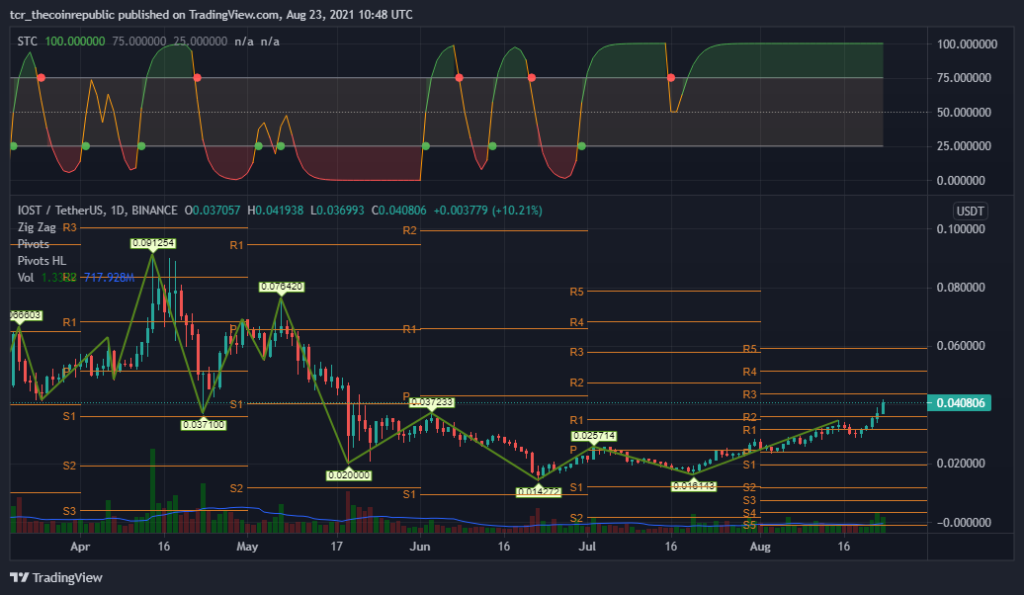
The daily technical chart of IOST crypto price action displays an uptrend. According to the pivot levels, the primary support level is $0.036. On the other side, if it rushes up, the resistance level to follow is $0.043. Although the chart forms a bullish engulfing candlestick pattern within the day, it is predicted that the price may remain upwards with medium reliability.
The Zig-Zag framed a top of $0.091 on April 14. After that, investors can notice a massive correction of 83%, all the way low to $0.014. Now price levels are back around the range of $0.04 this week.


The volume of (1.386B) is above the MA of 20-days (720.677M). As a result, the volume is too high, causing its price to break above the resistance zone. Investors may also mark that the volume bars on the chart are inclining, which intimates that notable volatility is expected in the upcoming trading session.
The Schaff Trend Cycle indicator (bullish) with a 100 represents a buy signal in the coin, projecting an uptrend. Additionally, Investors can see a green buy signal and an upward curve in the index.
IOST Crypto Heavy Buying Pressure is Initiated
The price of IOST today is 0.04052221 US dollars, and the 24-hour trading volume is 392,424,092 US dollars. The price of IOST has increased by 7.2% in the past 24 hours. The circulation of IOST coins is 23 billion, and the total supply is 22.7 billion. The STC indicator shows a buy signal, and the traders have guided high volume. Technically, the price breaks the resistance and remains in an uptrend. Therefore, as with overall market sentiment, the trend remains bullish.
Resistance Level: $0.043
Support Level: $0.036


