

- ARRR coin forming a cup and handle pattern in the daily chart.
- The ARRR/BTC pair was trading at 0.00008167 BTC with a gain of 2.08%
- The 24hr trading volume in the ARRR coin is $1.61 Million
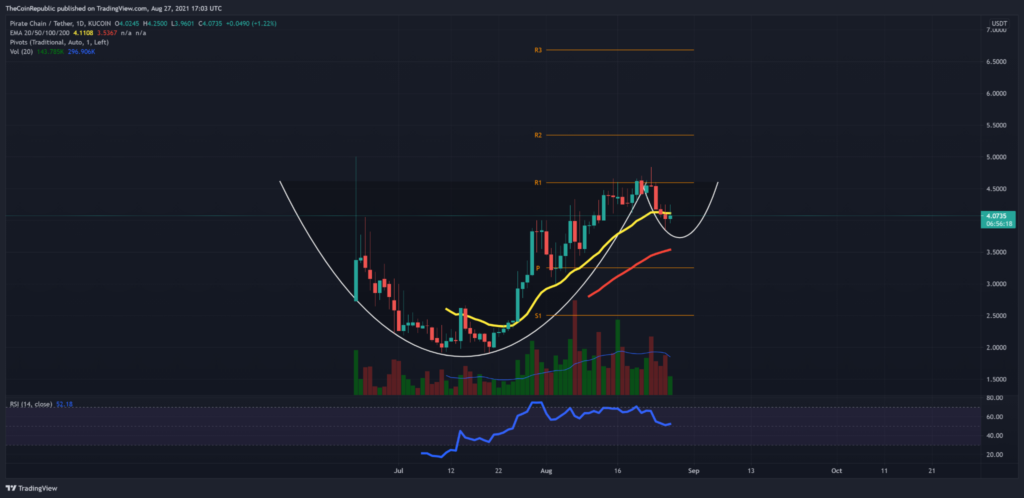
The ARRR price action forms the Cup and a handle pattern in the daily time frame. The bullish chart pattern could bring an excellent opportunity for ARRR traders with bullish sentiments, provided the price gives a bullish breakout above the $4 resistance level. Currently, the price shows the $3.94 level as the support of the handle structure of this pattern by forming a second Doji candlestick. The current price of the ARRR coin is $3.94, with an intraday gain of 2.23%
The RSI (BULLISH) value is at 52, indicating a rising underlying bullish sentiment in the coin. In addition, the RSI line shows regaining growth in its value as the price comes to fruition of the pattern.


ARRR Coin Crypto Chart In The 4hr Time Frame
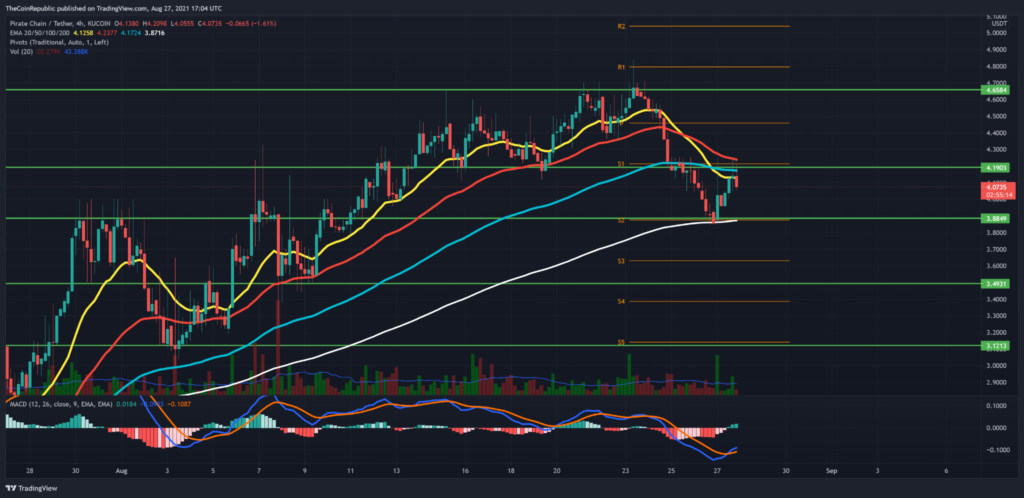
The ARRR coin showed a ‘V’ shaped recovery in the 4hr time frame after the price took support from the 200-day EMA support. Currently, the price is at the doorstep of the $3.5 resistance, and a breakout from this level should confirm the price going for the completion of the pattern.
As per the crucial EMA’s, the ARRR coin is in a bullish trendline as the price is trading above all the crucial EMA’s in the daily time frame.
The MACD indicator shows a bullish crossover of the MACD and the signal line, projecting a buy signal for the ARRR trader.
Conclusion: From the technical perspective, the overall market sentiment of the ARRR coin is bullish, and both the price action and indicators show a great bullish outlook for this coin. Thus, the ARRR can grab an excellent long opportunity once the price provides a decisive breakout from the $4 resistance level.
Support– $3.1
Resistance– $3.5, $4


