

- The Fantom coin is at a super upward trend around 43.5% during the intraday trading session.
- The 24-hour trading volume is at $444 million.
- FTM/BTC pair is trading positive by 44.7% at 0.00001498 BTC.
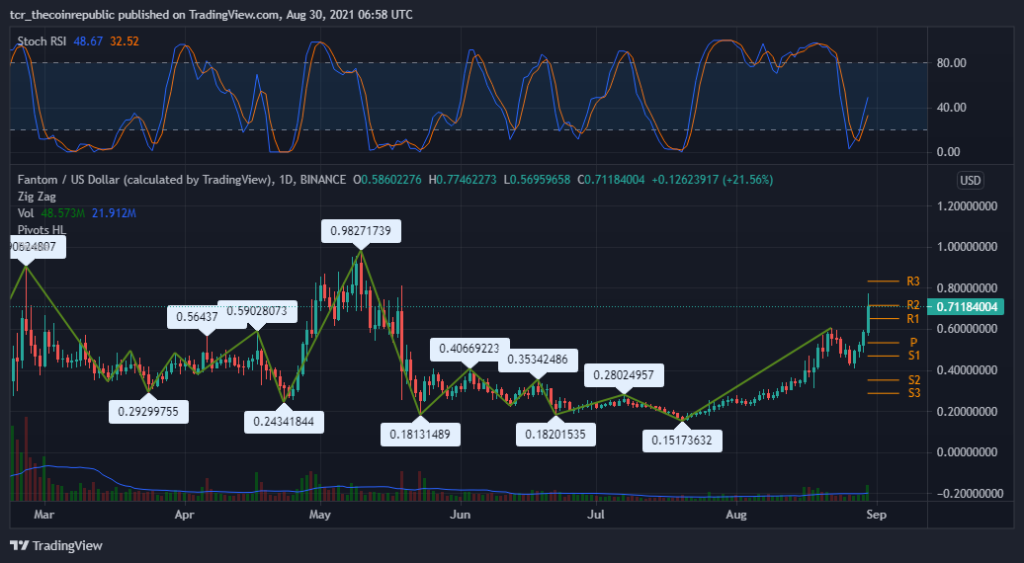
The daily technical chart and price action of Fantom coin display an upward trend. According to the pivot levels, the primary support level is $0.53. On the other side, if it rushes up, the resistance level to follow is $0.83. Although the chart forms a bullish engulfing candlestick pattern within the day, it is predicted that the price may remain upwards with high reliability.
The Zig-Zag framed a top of $0.98 on May 10. After that, investors can notice a massive correction of 84.50%, all the way low to $0.15. Now price levels are back around $0.70 this week.


The volume of (49.108M) is above the MA of 20-days (21.930M). As a result, the volume is high, causing its price to break above the resistance zones. Investors may also mark that the volume bars on the chart are inclining, which intimates that notable volatility is expected in the upcoming trading session.
The Stochastic RSI (bullish) with a value of K-49 D-32 presents a buy signal in the coin. Investors may observe an inclining slant and a positive crossover in the index. It may remain in positive territory for future trading sessions.
Fantom (FTM) Coin Expecting 20% Returns in Short Term
Fantom’s price today is 0.719975 US dollars, and the 24-hour trading volume is 444,728,647 US dollars. The price of FTM has increased by 43.5% in the past 24 hours. There are 2.5 billion FTM coins in circulation, with a total of 3.18 billion. The Stochastic RSI indicator shows a buy signal, and the traders have guided high volume. Technically, the price breaks above the resistance zone and remains in an upward trend. Therefore, as with overall market sentiment, the trend remains bullish in upcoming trading sessions.
Resistance Level: $0.83
Support Level: $0.53


