

- The RSI shows a slight bearish divergence concerning the EGLD coin price
- The EGLD/BTC pair was trading at 0.00614 BTC with a gain of 2.93%
- The 24hr trading volume in the EGLD coin is $852.4 Million
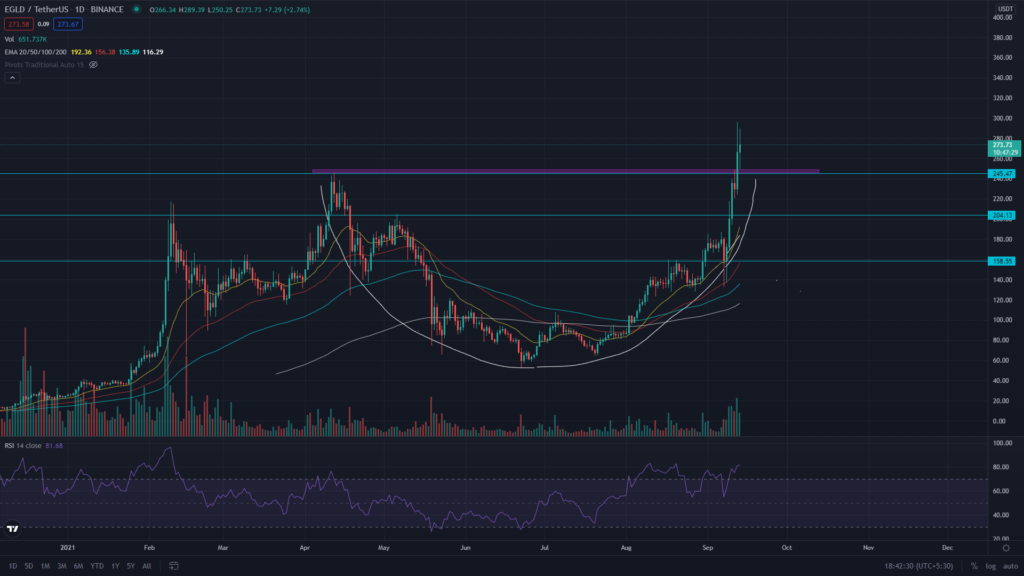
On 12th September, the EGLD coin offered an excellent opportunity for Crypto traders with the breakout from rounding bottom pattern in the daily time frame. This pattern indicates a strong bullish outlook, as it displays a complete change from a downtrend into an uptrend. The crucial resistance(neckline) for this pattern was the previous ATH(all-time-high) of $245, and today the price gives a retest to this level provide an entry opportunity for the crypto traders.
According to the EMA’s, the EGLD coin indicates a strong bullish trend, with the price moving high above the crucial EMA’s 20, 50,100, and 200 EMA.


The RSI (BULLISH) value is at 81, indicating a strong bullish sentiment in this coin. However, the RSI line indicates a slightly bearish sentiment regarding the price action, suggests a decreasing strength for market bulls.
EGLD Coin Crypto Chart In The 4hr Time Frame
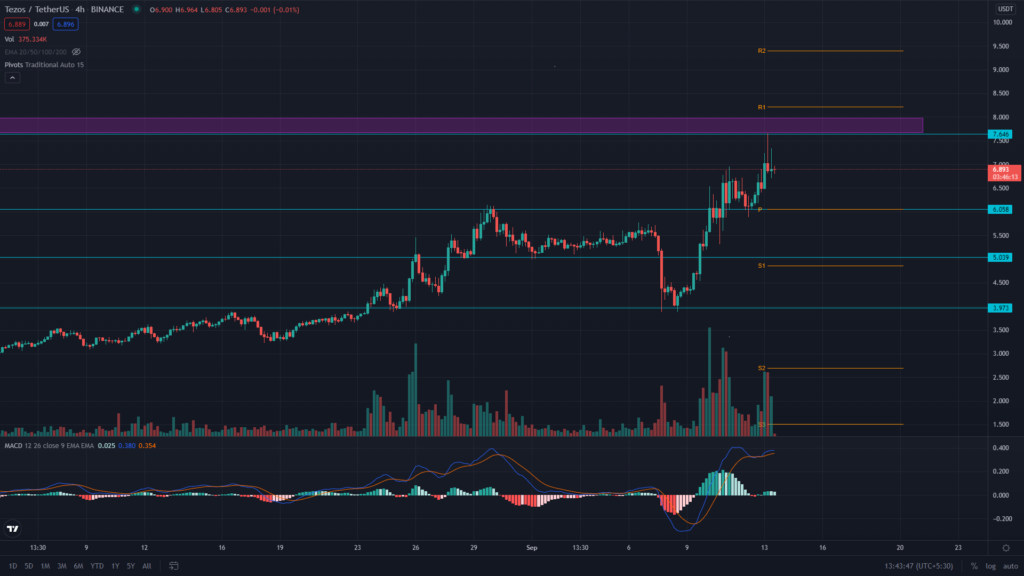
The EGLD coin showcased a strong bullish engulfing candle at $245, indicating the price has provided a proper retest for its breakout. Furthermore, the crypto traders can also consider adding more quantity in their position once the price breaches the $300 mark, which should be the final confirmation of the rounding bottom pattern. The current price of the EGLD coin is $278.7, with an intraday gain of 4.54%
The MACD (BULLISH) shows that both the MACD line and signal lines are moving above the neutral zone (0.00), indicating the bullish sentiment in the EGLD coin.
Conclusion: From the technical perspective, the overall trend of the EGLD coin is strongly bullish, and the trend traders should find favorable conditions to take a long trader. Such a condition is the breakout of a rounding bottom pattern, where the EGLD trader can grab a decent target of 1-2 traditional pivot levels.
Support– $245
Resistance– $300


