

- The AAVE crypto is in a downtrend, around 3.8%, during the intraday trading session.
- The 24-hour trading volume is at $354 million.
- AAVE/BTC pair is trading negative by 3.1% at 0.00673199 BTC.
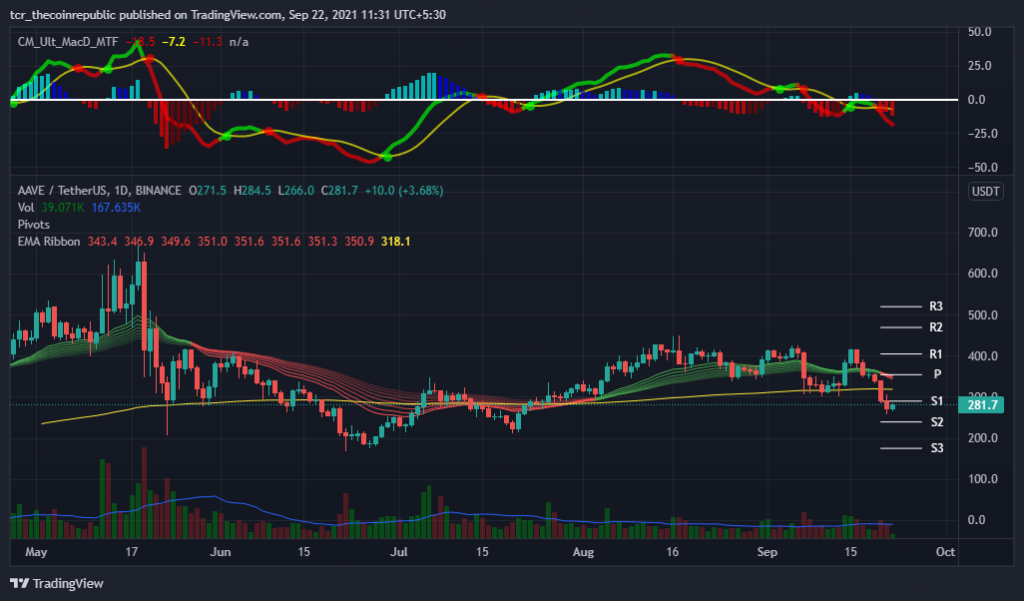
Daily technical chart and price trend of AAVE crypto are showing a bearish trend. Based on the pivot level, the first support zone is 240 USDT. From another perspective, if it rushes, the resistance level to watch is 355 USDT. Thus, the graph made a bullish harami candle pattern during the day, and the cost is relied upon to remain upside with unwavering medium force.
The Moving Average Exponential (EMA) Ribbon, comprising of different Ema’s, goes about as solid support in the coin price move. Investors might notice the cost slips below the green ribbon and is now below the red ribbon, so it will guarantee a downswing in Aave until it’s below the ribbon.


Trading volume (40.293 K) is underneath the 20-day moving average (167.700 K). To put it plainly, the volume is low, making the cost remain at the support levels. Investors can likewise check that the volume bars on the graph are slanting, which demonstrates that exceptional instability is normal in the following trading days.
The MACD indicator gives (bearish) cross over the signal line on Sep 20, demonstrating a sell signal in the coin. Additionally, Investors can see huge red bars on the Histogram index.
Aave Crypto Price Slips Below 200-EMA
Aave’s price today is $282.64, with a 24-hour trading volume of $354,485,789. The AAVE price has fallen by -3.8% in the last 24 hours. It has a circulating quantity of 13 million AAVE coins and a total quantity of 16 million. The MACD points to a selling indication, and the traders have prompted low volume. In fact, the cost is around the support regions. In like manner, with the general market perspective, the pattern stays bearish for coming trading days.
Resistance Level: $355
Support Level: $240


