

- Tron coin price setup over the monthly chart favors bulls, with higher high and lower lows price action.
- The crypto asset is currently struggling near its short-term moving average of the 20-day line while comfortably holding its 100 and 200-DMA lines.
- The pair of LTC/BTC is trading at 0.000002231 BTC with a 24-hour gain of +1.05%, and the ratio of LTC/ETH is CMP at 0.00003146 ETH with an intraday dip of -1.24%.
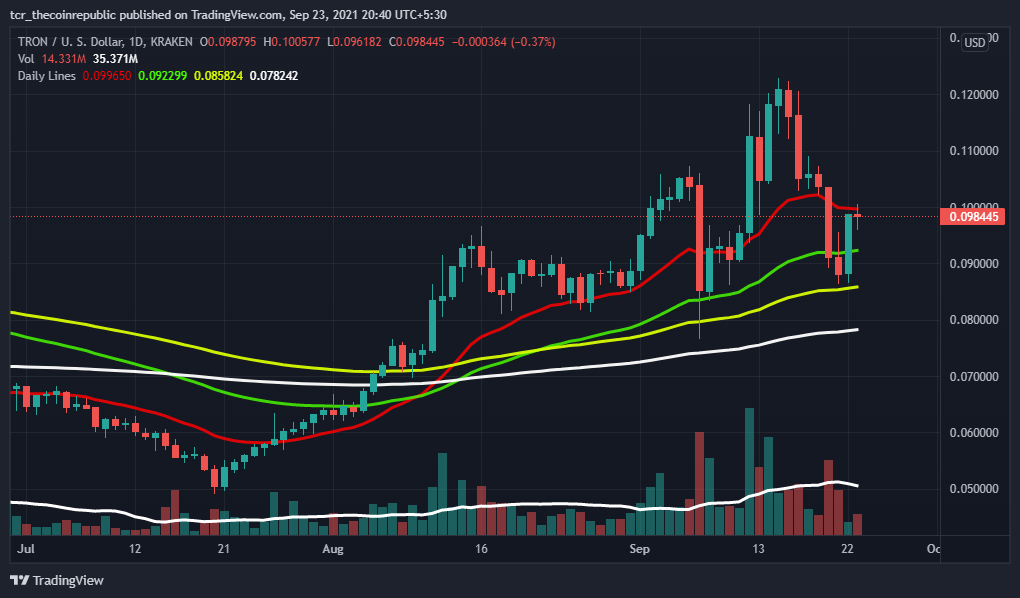
Tron coin is trading on a bullish note over the monthly chart, with strong bullish momentum. Meanwhile, the crypto asset is struggling near its short-term moving average of the 20-day line, with a slightly lower volume. TRX price is trading near its SMA of 20-day line and comfortably placed above 50, 100, and 200-Day lines.
Volume at the monthly chart is lower and needs to grow for another lap of bullish momentum in upcoming trading sessions. If the coin sustains above the SMA of 20 and50 with a supportive volume action, then soon see a strong positive rally. Whereas, if the coin fails to support 100 and 200-DMA, we could expect more corrections in upcoming sessions. Support on the lower side is $0.08725 and $0.08150, whereas resistance on the higher side is $0.1040 and $0.1120.


Tron coin is moving higher after testing its support area
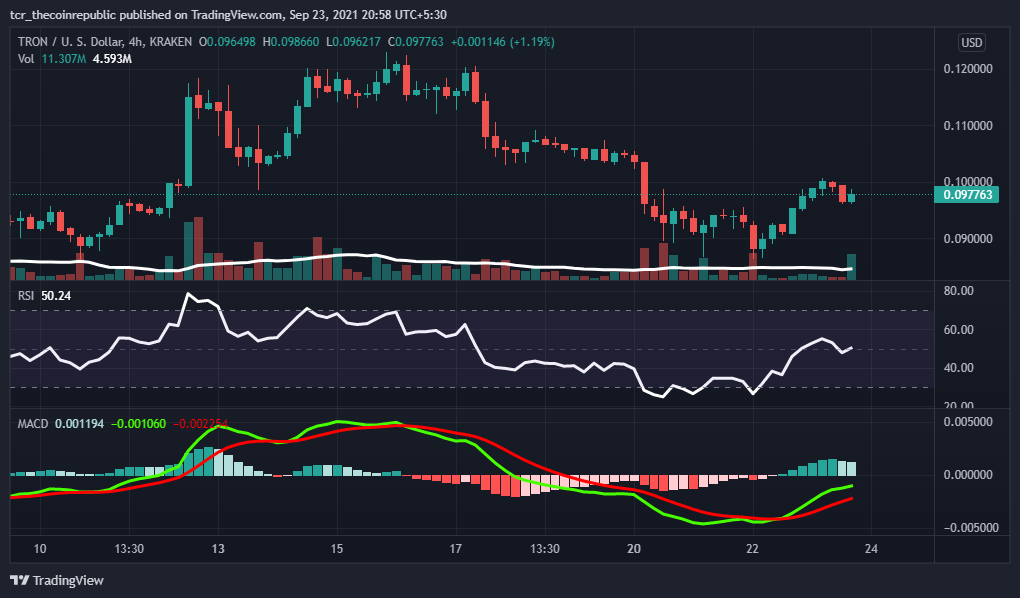
Tron coin is trying to rebound after testing its support area, and the technical parameters also indicate upcoming buying momentum. The technical parameters gradually head higher over the 4-hour time frame, with a slight improvement in volume activity. Volume activity over the weekly chart is still lower and needs to improve enormously in upcoming trading sessions.TRX, a token, is trading at $0.09750 with an intraday action of +3.38%, and the volume to market cap ratio is at 0.2001.
Relative Strength Index (BULLISH): Tron coin RSI is trading on a positive note over the weekly chart. In contrast, the RSI is heading higher after testing the oversold zone and CMP at 49.
Moving Average Convergence Divergence (BULLISH): The daily chart indicates a positive trend at the 4-hour time frame. At the same time, the buyer’s signal line (green) is overpowering the seller’s line (red) with a positive crossover.
Support levels: $0.08725 and $0.08150
Resistance levels: $0.1040 and $0.1120.


