

- The REN token price obtaining strong support from the 50-day EMA
- The REN/BTC pair was trading at 0.0002448 BTC, a gain of 30.19%
- The 24 trading volume of REN token is $2.79 Billion
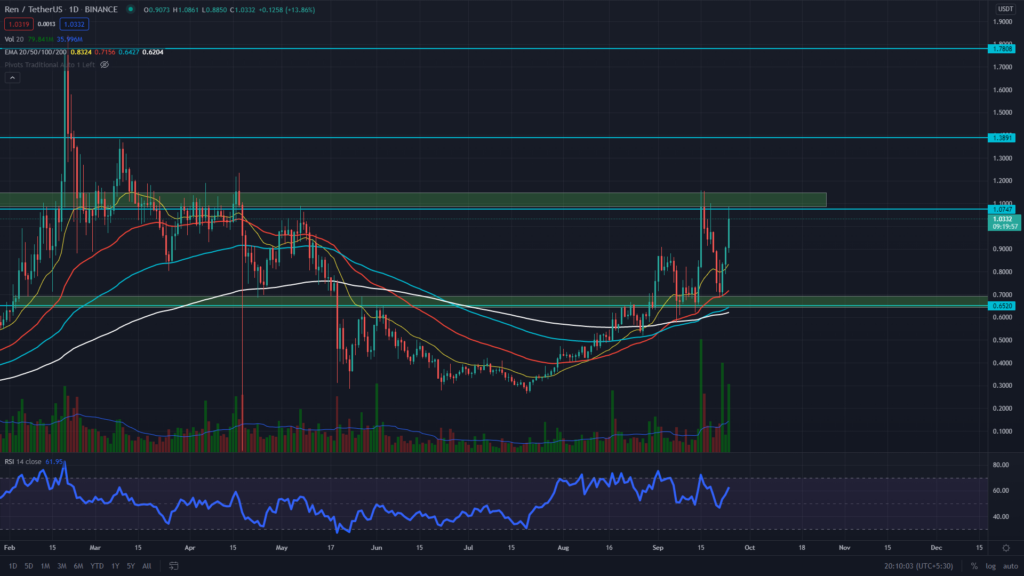
The REN token displays the formation of a Cup-and-Handle pattern within the daily timeframe. This pattern’s neckline is located around the $1.1 mark. After the handle portion is completed, the price returns to the threshold of this overhead resistance. The REN traders should therefore wait for the token to fully breakout before entering.
Concerning the EMA’s, The price of the REN token is trading higher than the critical EMAs 20, 50, 100 and 200, indicating a bullish trend. In addition, the 50 EMA is providing strong support to the token price.


The RSI value (BULLISH) is 62, indicating bullish sentiment. However, the chart shows a significant bearish divergence in the token’s price, projecting some weakness in the bullish momentum.
REN token Price May Enter A Consolidation Phase
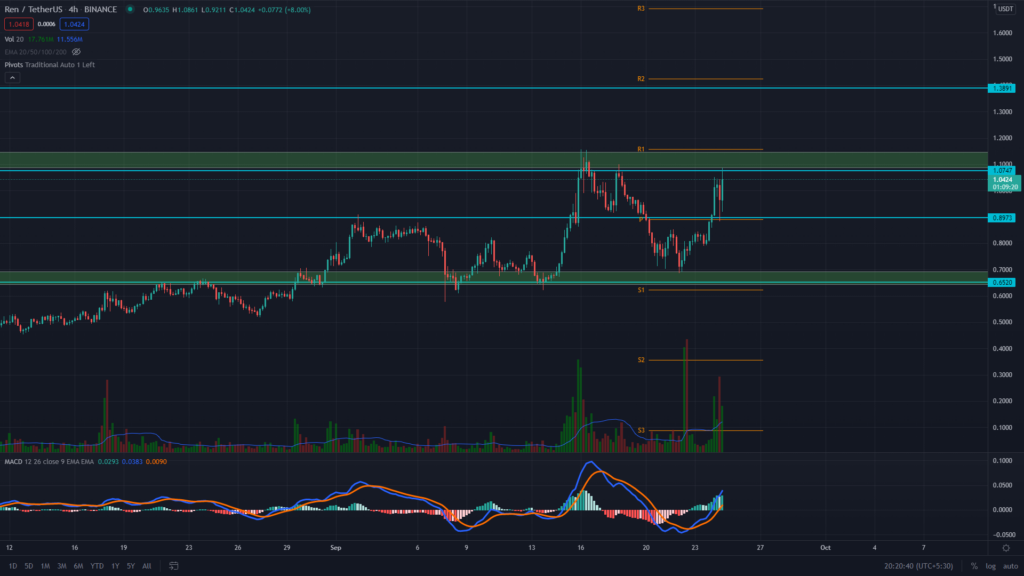
The REN token at a lower time price, such as 4hr, provides a more detailed picture of the chart, indicating another possibility for this token. The strong bearish divergence is RSI mentioned above cannot be neglected, suggesting weakness in the bull rally. Thus, if the price rejects the overhead resistance level of $1.1, the token shows a good possibility of entering into a small consolidation phase.
Moreover, the REN traders can use the traditional pivot levels in the chart, as the price seems to be respecting its levels, providing them with a better confirmation and an extra edge in their trading.
The moving average convergence/divergence(MACD) indicator shows both the MACD line and signal have crossed higher than the neutral zone(0.00), indicating a bullish momentum in the token.
Conclusion: The technical outlook for the REN coin is bullish. And the price is currently close to the neckline of the Cup and handle patterns. If it manages to break this resistance level, it could provide a strong directional move.
Support: $0.9
Resistance $1.1


