

- Compound coin price seems to prepare for an upcoming bullish rally if the coin manages to jump above its necessary moving averages.
- The crypto asset over the monthly chart is currently trading below its major moving averages of 20, 50, 100, and 200-day lines, with average volume action.
- The pair of COMP/BTC is trading at 0.008169 BTC with a 24-hour loss of -0.05%, and the ratio of COMP/ETH is CMP at 0.1157 ETH with a minor intraday dip of -0.94%.
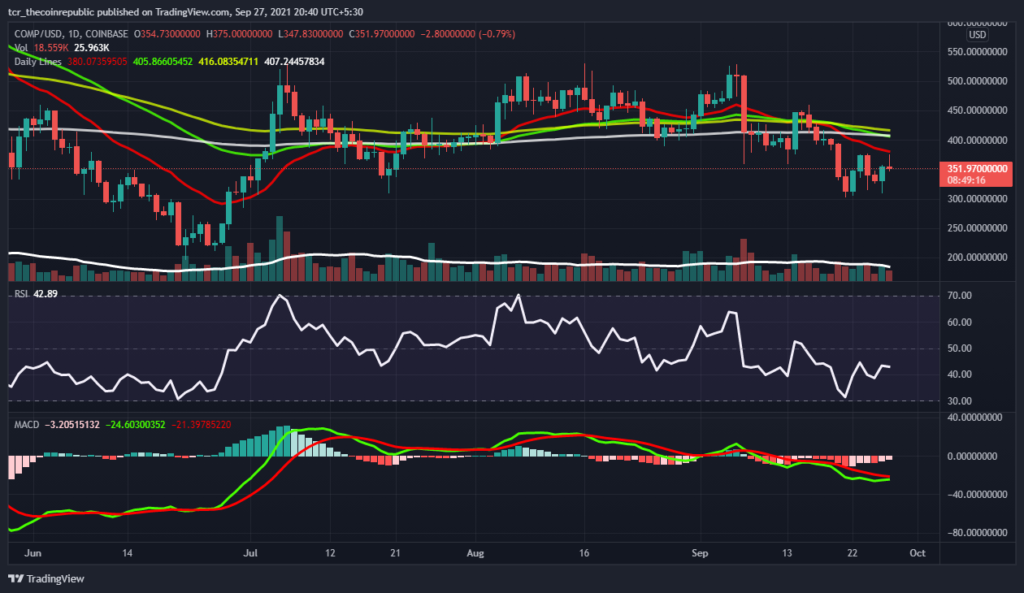
Compound coin price at the monthly chart is trading just below its all vital moving averages of 20, 50, 100, and 200-day lines. At the same time, the gradual selloff from higher levels pulls the token towards the lower levels. The technical parameters are heading lower, and volume activity over the chart is also recorded near the average line. Currently, the crypto asset is trying to move higher but facing minor rejection of its short-term moving average of 20 and 50-DMA lines.
Once the crypto asset sustains above its vital moving averages of 20, 50, 100, and 200-DMA, with a supportive volume action. Volume over the chart needs to increase in upcoming trading sessions for a strong comeback of bulls. Support on the lower side is $300 and $285, whereas resistance on the higher side is $430 and $485.


Compound coin is consolidating after a sharp correction from the higher levels
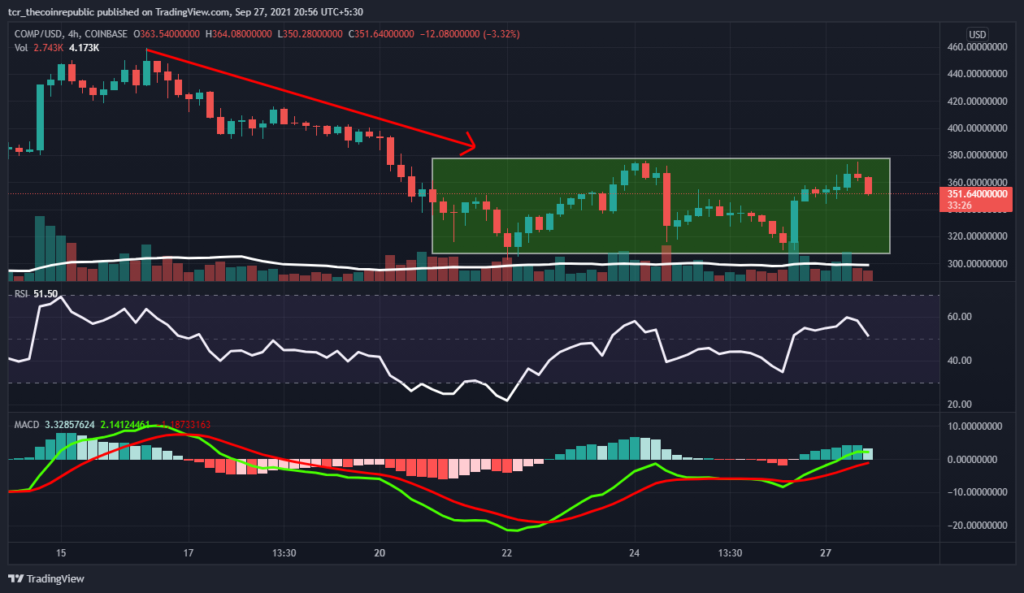
The compound coin at the weekly chart is consolidating after a sharp correction from the higher levels. Moreover, either side breakout of the range will create strong momentum in upcoming trading sessions. Technical parameters are gradually turning negative after a good recovery from the oversold zone. COMP token is trading at $351 with a minor intraday drop of -0.39%, and the volume to market cap ratio is at 0.08631
Relative Strength Index (NEUTRAL): Compound coin RSI is trying to rebound over the weekly chart. In contrast, the RSI is trading flat after testing the oversold zone and CMP at 52.
Moving Average Convergence Divergence (NEUTRAL): The daily chart indicates a neutral trend at the 4-hour time frame. At the same time, the buyer’s signal line (green) overpowering the seller’s line (red) and heading closer.
Support levels: $300 and $285
Resistance levels: $430 and $485.


