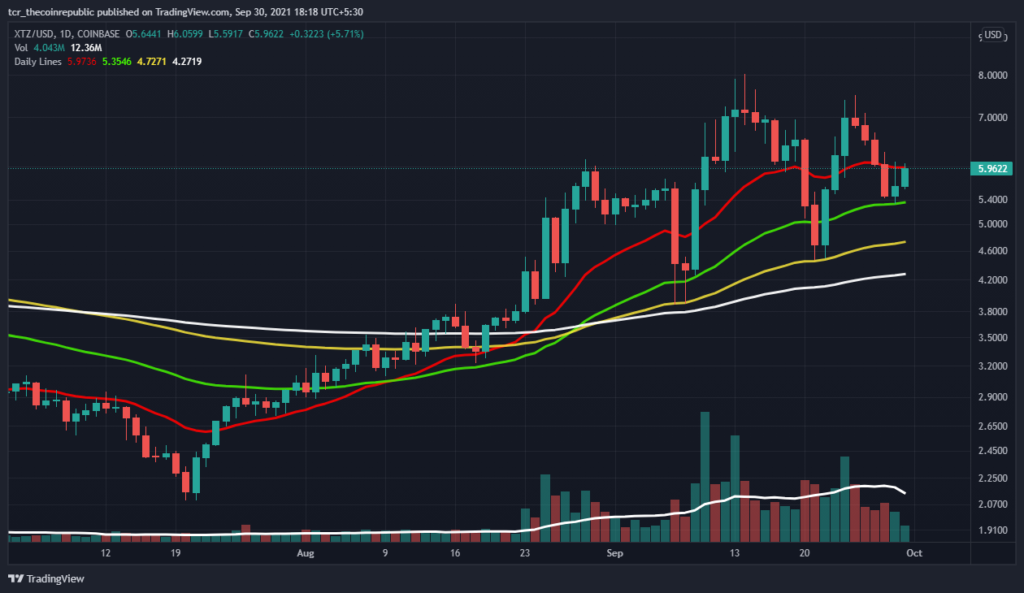
- Tezos Coin at the monthly chart is again turned bullish from the 50-day short term moving averages after a minor pullback from higher levels.
- The crypto asset is trading on a bullish note, while bulls manage to keep the crypto token above its long to medium term moving averages of 50, 100 and 200-days.
- The pair of XTZ/BTC is trading at 0.0001368 BTC with a 24-hour loss of -2.35%, and the ratio of XTZ/ETH is CMP at 0.001974 ETH with an intraday drop of -2..64%.

Tezos coin price over the monthly chart is trading on a bullish note while making higher highs and lower lows. Currently, XTZ is comfortably sustaining above its vital moving averages of 50, 100 and 200-day lines at the time of writing. The crypto asset on the higher side facing a minor hurdle of its short term moving average of the 20-day line. Volume activity over the chart has increased since the past few trading sessions but needs more growth for the next lap of bullish momentum.
The overall medium to long term trend is still bullish until the token manages to sustain above its 50, 100 and 200-day lines. Support on the lower side is $5.42 and $4.71, whereas resistance on the higher side is $6.74 and $7.51.
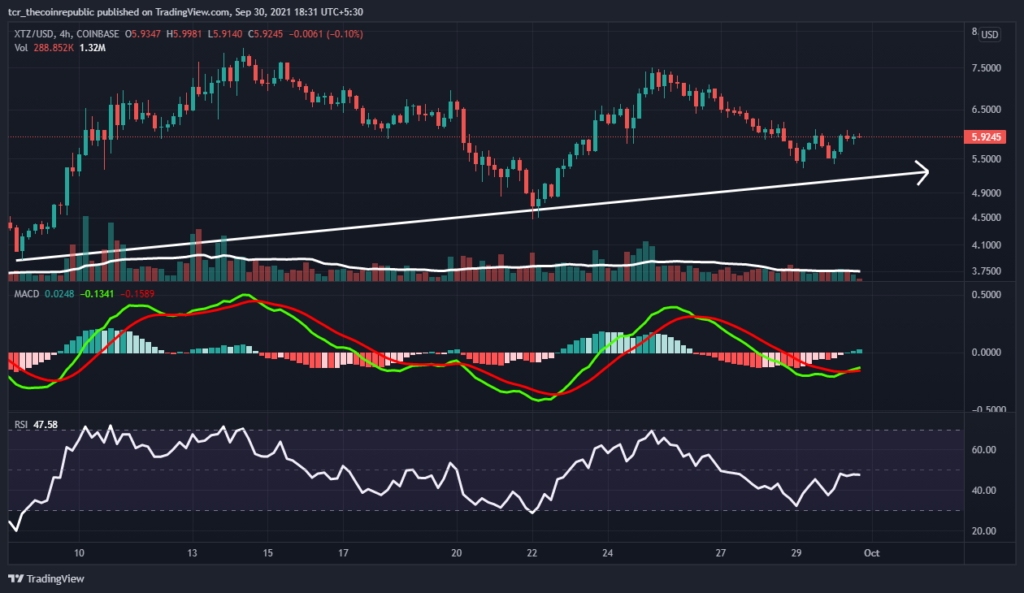
Tezos coin is trading on a positive note while respecting its rising trend line

Tezos coin at the weekly chart is trading on a positive note while respecting its rising trend line. However, the volume at the chat is lower and needs to grow strongly for another bullish cycle. The technical parameters are now at the neutral point, trying to turn positive but need a clearer trend. At the 4-hours time frame, the trend is still favouring bulls until the token sustains above the rising trend line. XTZ token is trading at $5.91 with an intraday gain of +0.39%, and the volume to market cap ratio is 0.1238.
Relative Strength Index (NEUTRAL): Tezos coin RSI is trading under sideways momentum after a correction from higher levels. The coin is currently trading sideways towards the neutral zone and CMP at 48.
Moving Average Convergence Divergence (MIXED): The daily chart indicates a mixed trend at the 4-hour time frame. At the same time, the seller’s line (red) overlaps the buyer’s signal line (green).
Support levels: $5.42 and $4.71
Resistance levels: $6.74 and $7.51.


