

- QTUM Token price action projects a bullish uptrend as the bullish momentum sparks suddenly.
- QTUM Token price trades above all the crucial EMAs in the daily chart.
- The pair QTUM/BTC is trading at 0.0002429 BTC with an intraday gain of +1.65%.
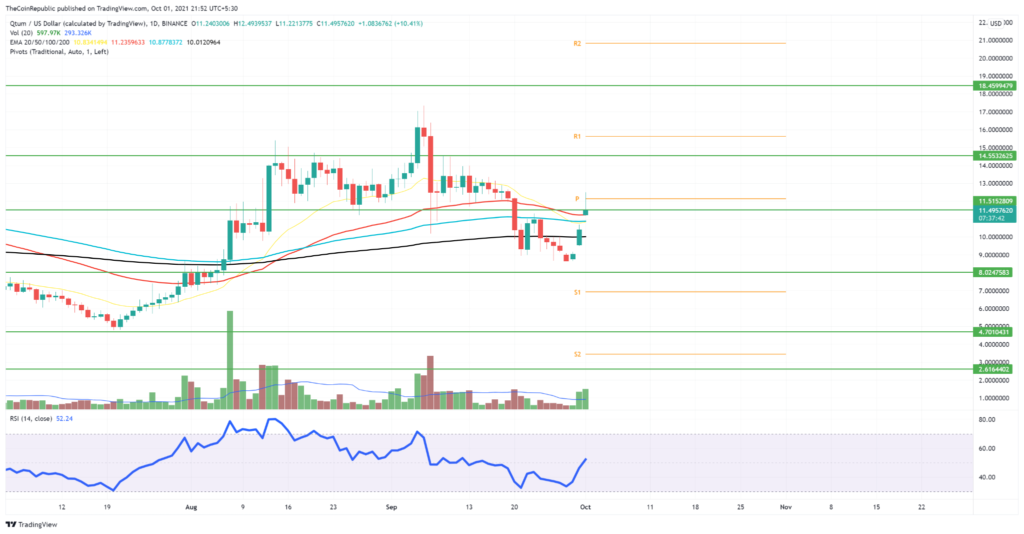
QTUM token price action shows a bullish engulfing candlestick in the daily technical charts, which indicates increased underlying bullish sentiments. In addition, the price rises from the demand met near the support level of $8, indicating that the bullish sentiments are on the rise.
The intraday volume has risen above the 20-days volume MA, indicating that there is more buying pressure. Moreover, the bullish alignment of the daily EMAs means that the token price has additional support levels.


QTUM Token trades at $11.51, an increase of +12.45% market capitalization over one day. This suggests that the price is on a bull reversal. Moreover, the intraday trading volume has increased by around 50%.
QTUM Token Price Rises In 4-hour Chart
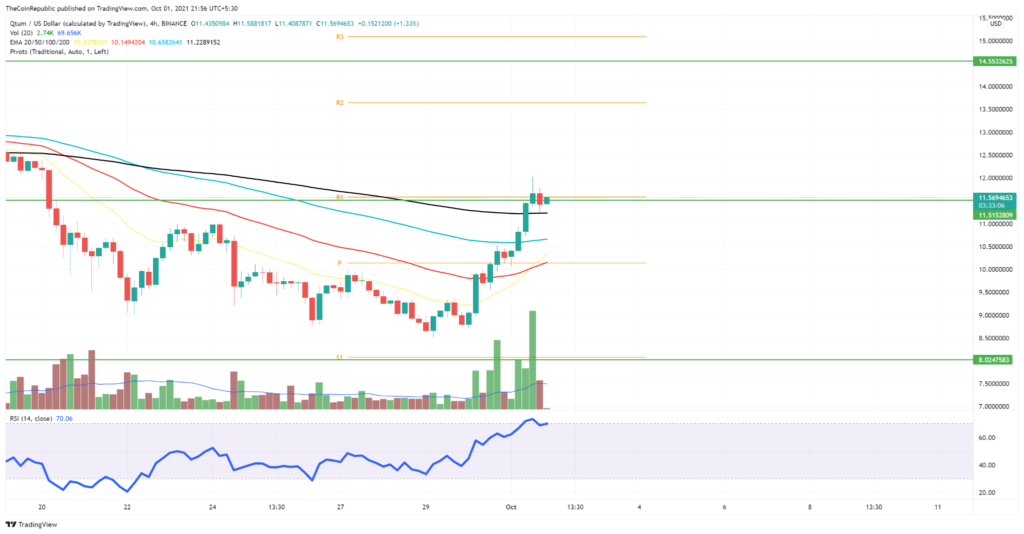
QTUM token prices action denotes a sudden rise in bullish sentiments evident by the continuous formation of the bullish engulfing candlestick in the 4-hour chart. The price breaks above the $10 mark, and it may even continue to head higher.
According to price action, demand levels for the token are at the $10 and $8 mark. As a result, bulls could encounter resistance at $15 and $18 if the bullish trend persists above the $12 mark.
The EMAs on the technical chart for the 4-hour chart are more powerful, as the price breaks above the 200-period EMA. Furthermore, the dips to the 200-period EMA can be seen as a buying opportunity.
The RSI indicator indicates a sudden rise in underlying bullish inclinations. Furthermore, the RSI slope rises towards the overbought zone in the daily chart.
The ADX indicator indicates a rise in trend momentum.
Conclusion: The QTUM token’s price has been rising higher in the past few sessions in the 4-hour chart. Moreover, the price breaks above the 200-day EMA in a shorter timeframe. Therefore, it can shortly retest the bullish breakout before continuing the trend.
Support – $10 and $8
Resistance – $15 and $18


