

- AR Token price has increased more than 30% in the past two weeks.
- The price action forms a solid consolidation range in the daily chart.
- The pair of AR/BTC is trading at 0.001127 BTC with an intraday gain of +11.15%.
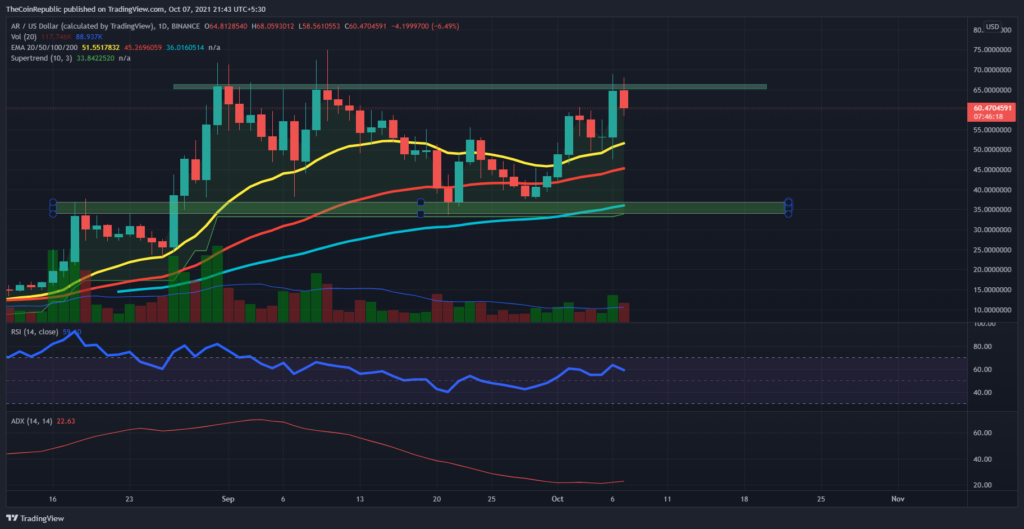
AR coin price action indicates a reversal from the solid resistance zone near the $65 mark in the daily technical chart. Furthermore, the price action forms a long consolidation range.
The intraday volume is above the 20-days volume MA representing that the selling pressure is increasing. In Addition, the daily EMAs rise higher in a bullish alignment, projecting a bullish rally.


The AR Token price trades at $60.49, increasing +10.45% in market capitalization over the past day, suggesting that the price is in a bull run.
AR’s intraday trading volume has risen by 300% due to the increasing buying pressure.
AR Token In The 4-hour Chart
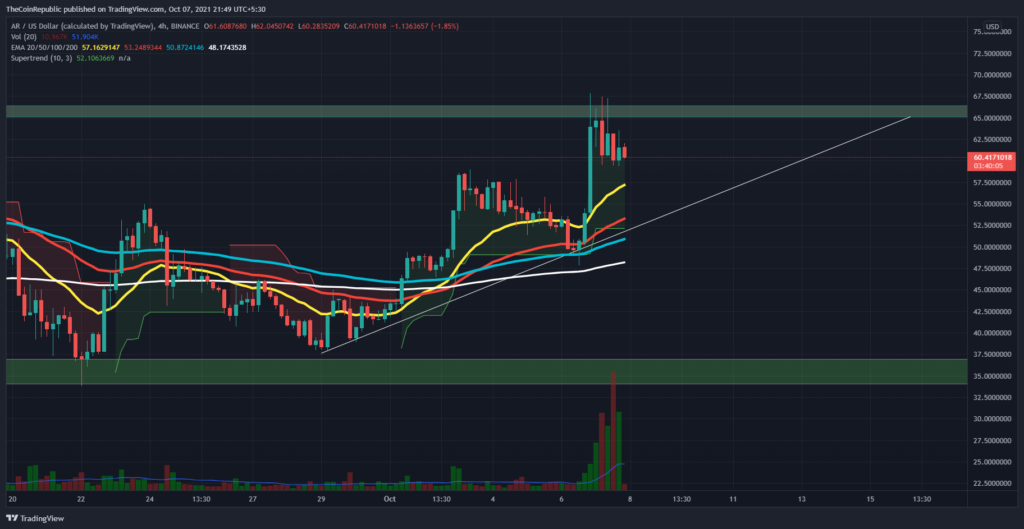
AR token price shows higher price rejection as it fails to rise above the $65 mark. However, investors may find the retracement to the support trendline as a lucrative entry spot with minimum risk and maximum reward.
As per price action, the support levels for the token are residing at $55 and $40 marks. In the case of a bullish reversal from any support level, bulls may find resistance at $65 or $80.
The EMAs in the 4-hour technical chart climb higher in a bullish formation with a positive slope that may support the prices in a bearish attack.
The RSI indicator anticipates a flood in underlying bearishness as the slope of RSI spikes down.
The ADX indicator proposes a fall in trend momentum.
Conclusion – The AR token price resonates within a solid consolidation range in the daily chart. The recent reversal from the resistance might soon drive the price back to the $40 mark. However, the breakout on either side will bring a massive move.
Support – $55 and $40
Resistance – $65 and $80


