

- The SC token shows a bullish crossover of the 20-and-200-day EMA
- The SC/BTC pair trading at 0.0000003649 BTC, with a gain of 6.99%,
- The 24 hr volume of SC tokens are $133.9 Million
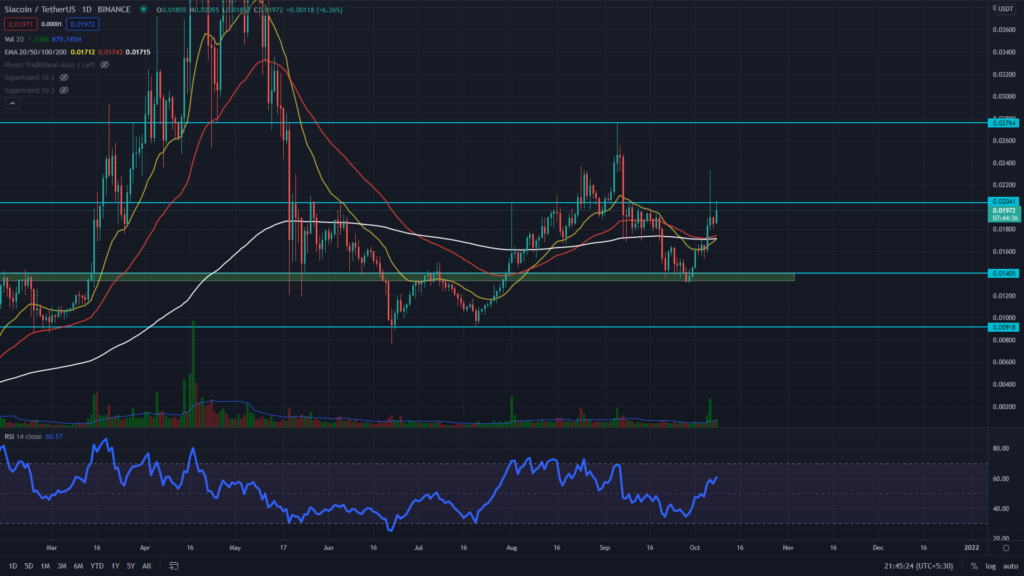
On September 22, the SC token signaled that it had completed its retracement phase when the price bounced off $1.4 support by forming a morning star candle pattern. The token price is currently at the doorstep of the strong resistance of $0.002, where the chart displays intense selling pressure above it, with a long higher price rejection candle.
Concerning the EMAs, the SC price has a strong bullish tendency with its price trading higher than the important EMA’s 100 and 200. Moreover, the coin chart shows a bullish crossover between the 20- and 200-day EMAs, attracting more buyers to this coin.


The RSI value of 61 indicates a bullish sentiment in SC tokens. The RSI line also shows a substantial rise in its value, suggesting that buyers are returning to this coin.
The SC Token Chart Features A Cup And Handle Pattern.
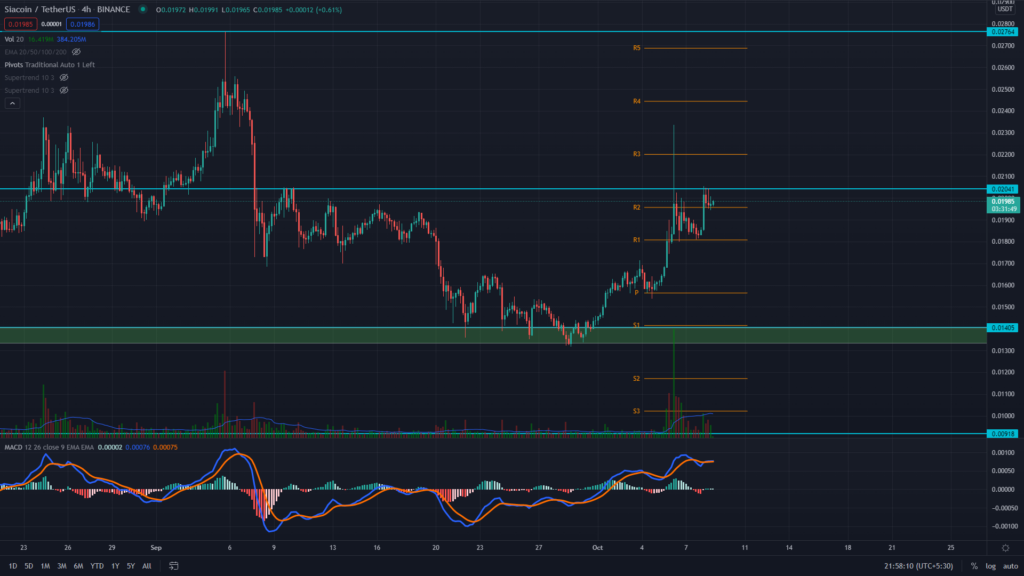
The SC token shows a cup and handle pattern formation in the 4hr time frame chart. This pattern’s neckline is located at $0.0038 and offers an excellent long opportunity for Crypto traders if the token price makes a decisive breakout from his level. The SC token is currently trading at $0.0198, with an intraday gain of 7.17%.
The moving average
convergence/divergence(MACD) indicator shows the MACD and signal lines are moving above the neutral zone (0.00), indicating the bullish momentum in the token.
Conclusion: The SC coin short-term trend is still bearish. However, the technical chart shows a bullish outlook on its price action and indicators, as the price has started rising after rebounding from $0.014 support. The coin also reveals a cup-and-handle pattern that could offer the crypto trades a long entry opportunity once the price breaks free from this $0.2 resistance.
Support $0.017
Resistance $0.02


