

- The NEXO coin price struggles around 55-EMA during intraday.
- The 24-hour trading volume is at $11 million.
- NEXO/BTC pair is trading negative by -6.9% at 0.00002696 BTC.
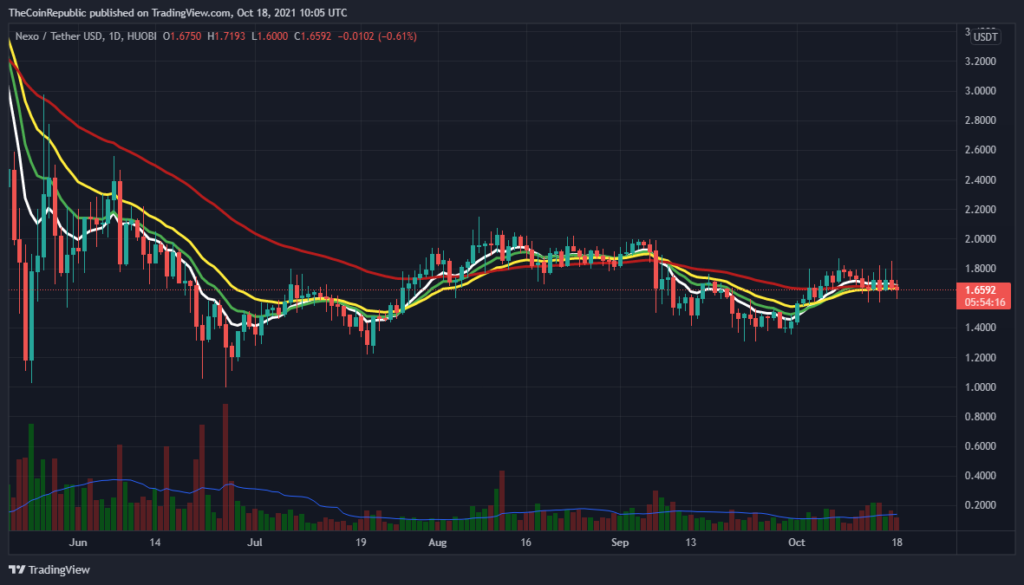
On the daily chart of NEXO coin, The Moving Average Exponential (EMA), consisting of 8,13,21,55-EMA, Acts as reliable support in the token price movement. Investors may observe the price is struggling between all the lines, so until the price resides above the multiple EMA’s, it will assure an uptrend in NEXO.
Trading volume (735.536 K) is close to the 20-day moving average (786.228 K). The volume is high, so the cost is trying hard to break out of the range. Investors may also notice that the volume bar on the chart decreases. This indicates that unusual volatility is common on the following trading days.


NEXO Coin Price Trend Gradually Moves Towards The Supply Zone
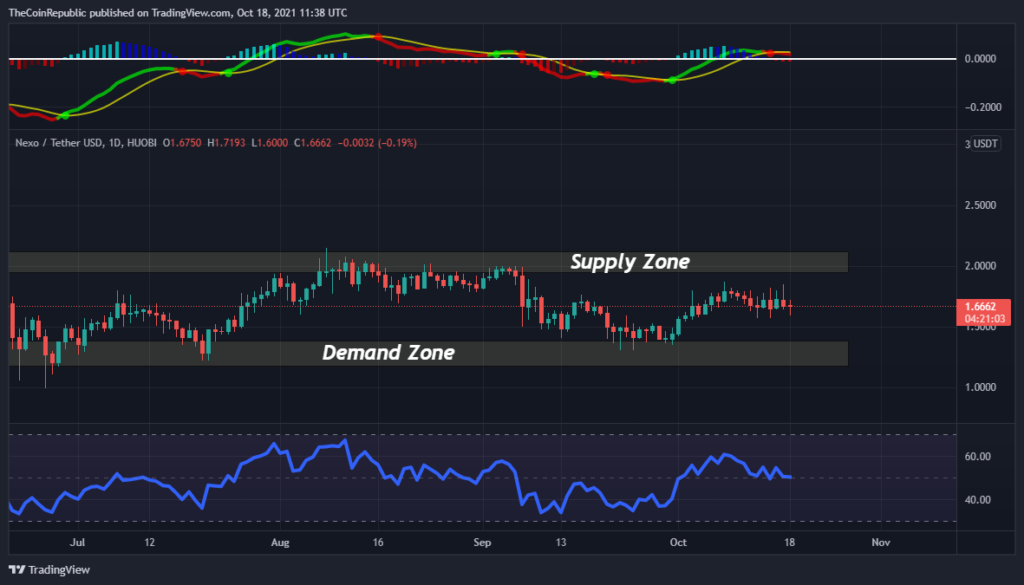
NEXO coin daily technical chart and price trend show an uptrend. Based on the price action, the supply zone is located at 2.0 USDT. On the other hand, the demand zone to look for is 1.20 USDT. Therefore, the chart shows a dragonfly Doji candlestick pattern during the day.
The RSI indicator gave a signal (Neutral) with 64, projecting a flat sign in the currency. Investors can observe a flat trend on the index. It can rise in future trading sessions.
The MACD indicator gives (bearish) cross over the signal line on October 15, demonstrating a sell signal in the coin. Additionally, Investors can see tiny red bars on the Histogram index.
Conclusion
NEXO price today is $1.67 with a 24-hour exchanging volume of $11,361,863. NEXO cost is down – 6.1% as of now. It has a coursing supply of 560 Million NEXO coins and a complete inventory of 1 Billion.
The RSI shows a neutral signal and MACD points to a sell signal. The traders have prompted high volume. In fact, the cost is halfway towards the supply zone. Likewise, the general market outlook is that this pattern will continue to rise over the next few trading days.
Resistance Level: $2.0
Support Level: $1.20


