

- The MINA coin bears have reclaimed the 20-day EMA line
- The MINA/BTC pair was trading at 0.000007329 BTC with a gain of 6.63%
- the 24-hours trading volume in the MINA coin is $87.7 Million, indicating a 58% hike
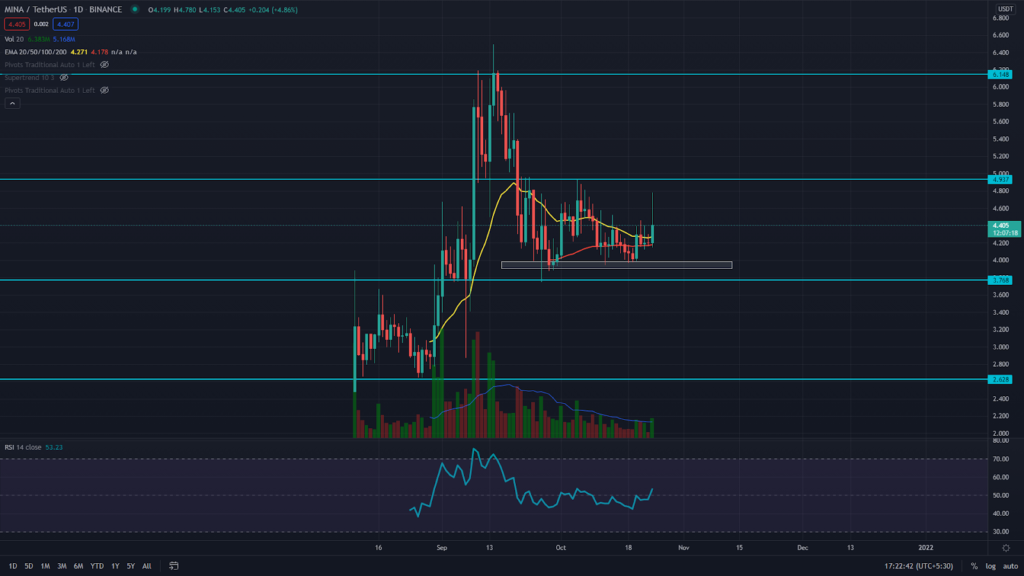
On October 20th, the MINA coin price bounced from the $4 support with a bullish engulfing candle, indicating good demand pressure below this level. Moreover, the technical chart also shows the possibility of forming a double bottom pattern. The neckline for this pattern is at the $5-$4.95 mark, holding the entry trigger for this pattern.
The RSI value is at 53, indicating a bullish sentiment in the coin.


The MINA Coin Chart In The 4-hour Time Frame
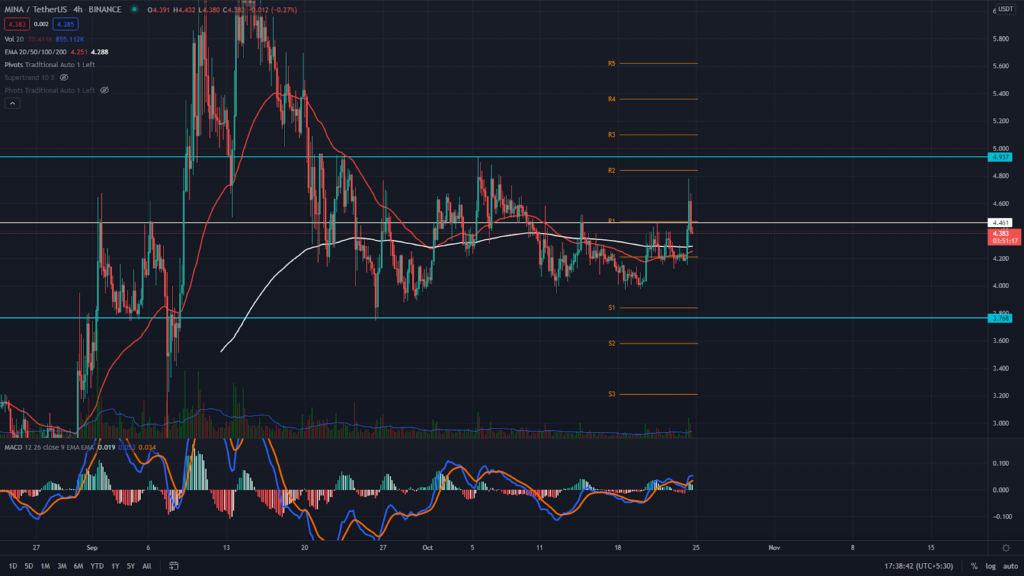
The MINA coin price action in the 4-hour chart contradicts the daily chart, as the price couldn’t sustain above the minor resistance level of $4.46. The chart showed a decisive breakout from this resistance level with significant volume support. However, the retest candle couldn’t hold above this level and immediately dropped below it, indicating a fakeout.
If the price continues to fall, the chart would indicate a short consolidation period for this coin. Furthermore, the nearest strong support level the chart shows is at the $4 mark.
The EMA’s indicate a bullish outlook for the MINA coin, as its price is trading above the crucial EMA’s (20, 50, 100, and 200). Moreover, the chart also shows a bullish crossover of the 20 and 200 EMA, attracting even more buyers in this coin.
The moving average convergence/divergence indicator (BEARISH) shows the signal and MACD lines are moving above the neutral area (0.00), indicating the bullish momentum in the coin.
Conclusion: From the technical perspective, the short-trend for the MINA coin is still bearish. However, the price is resonating between the $5 and $4 levels, and the crypto trade can only expect a proper trend once the price breaks free from either of these levels.
Support: $4
Resistance: $5


