

- The ICP is facing strong resistance from the 50-day EMA
- The ICP/BTC pair was trading at 0.000775 BTC with a gain of 11.04%
- The 24hr trading volume in the ICP coin is $739.9 Million, indicating a 299% hike
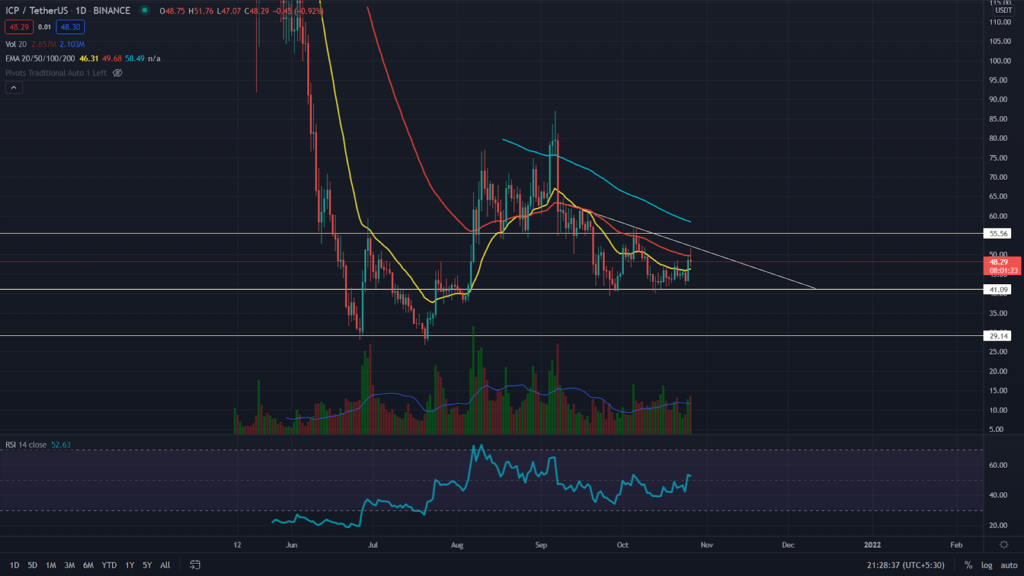
The ICP coin displayed a descending triangle pattern in the daily time frame chart. The crucial support(neckline) for this pattern is at the $41mark, holding an excellent short opportunity for crypto traders once the price gives a proper breakout from this bottom support. The ICP coin is trading at $48.35, with an intraday loss of 0.8%.
According to the EMA’s, The ICP coin’s price is trading below the crucial EMA’s of 20, 50, and 100, indicating a downtrend in this coin. Moreover, the 50 EMA acts as strong dynamic resistance for the ICP coin price.


The RSI (BULLISH) value is 52, indicating a neutral to slightly bullish sentiment in the coin market. However, the investors can notice a bullish divergence in the RSI line, projecting the increasing strength of the coin buyers.
ICP Coin Price Rejected From The Descending Trendline
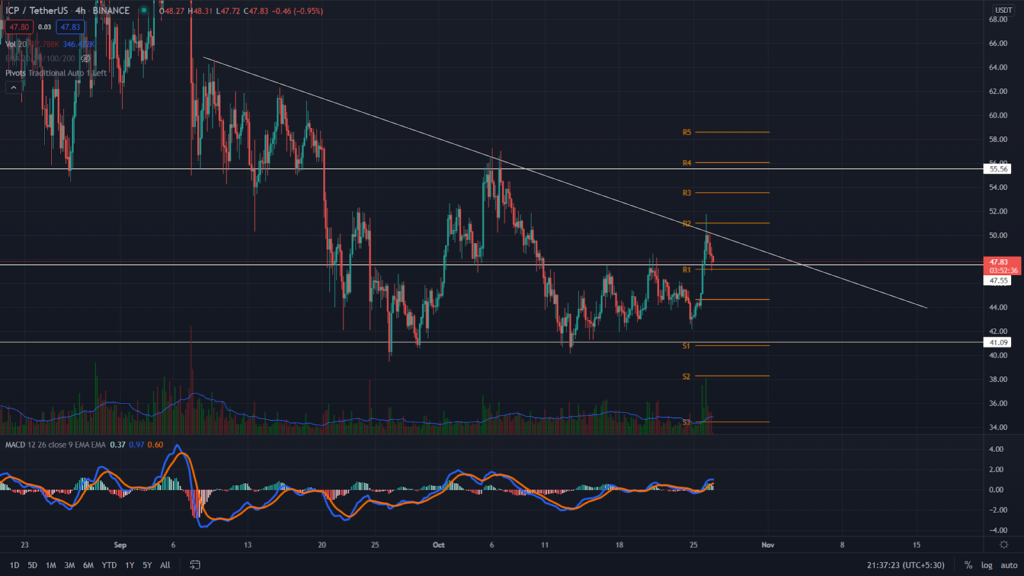
This lower time frame chart shows the ICP coin price was rejected from the descending trendline by forming an evening star candle. As per an ideal descending triangle pattern, the coin should now plunge to the bottom support for the $41 mark.
According to the traditional pivot levels, the next horizontal resistance level for ICP price is $51, followed by the $53.5 mark. The nearest support levels are $47 and later $44.5.
The MACD indicator (BULLISH) indicates a bullish momentum in the coin as both the MACD line and signal lines are moving higher than the neutral zone(0.00).
Conclusion: From the technical perspective, the overall trend of the ICP coin is bearish. As mentioned, the chart also reveals another bearish pattern, indicating an even more fall in this coin.
However, the RSI indicator contradicts these bearish sentiments, and therefore, the crypto traders should wait and see where the price gives a proper breakout before entering a new position.
Support: $47
Resistance: $51


