

- The ZEN coin price reclaims the 20-and-50-day EMA line
- The ZEN/BTC pair traded at 0.0017 BTC, with a gain of 37.22%,
- The ZEN’s coin 24-hour trading volume is $560.8 Million, indicating a 1577% hike
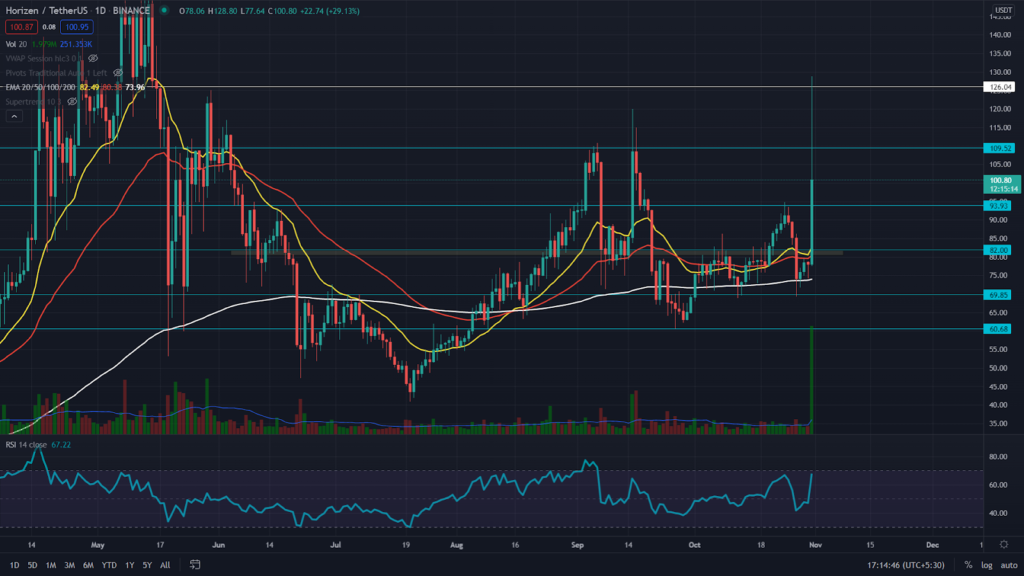
As mentioned in my previous article on Horizen, the ZEN token provided a bullish breakout from the ascending triangle pattern, offering the long traders a quick target to the $94 mark. Later, the token entered into a minor retracement which plunged the price to the $70 mark.
The token managed to sustain above this support level and today showed a sudden surge in price, which even reached the $125 level. Moreover, the ZEN token showed a massive burst in its volume activity, indicating a 1611% hike.


Regarding the EMAs, the ZEN coin’s price is trading above the EMAs 20, 50, 100, and 200, indicating a solid uptrend. Moreover, the token price also reclaimed a 20 and 50 EMA line, providing more confirmation for this rally.
The RSI value (BULLISH) stands at 69, indicating a bullish sentiment about the price movement.
ZEN Coin Enter A Minor Retracement Phase
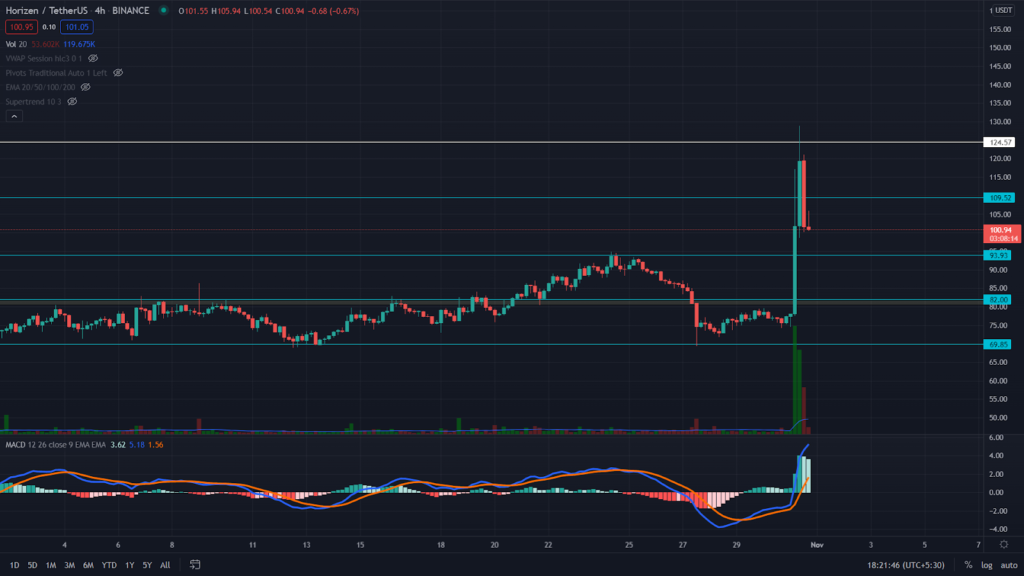
The ZEN token faced strong rejection from the $125 mark, displaying a long bearish engulfing candle. The ZEN price has dropped below a crucial level of $110 and indicates the token has entered into a minor retracement phase. The ZEN coin currently trades at $100, with an intraday gain of 28.2%.
The moving average convergence/divergence indicator (BULLISH) shows the MACD and signal lines moving higher than the neutral zone (0.00), indicating bullish sentiment.
Conclusion: From a technical perspective, the ZEN token indicates the overall trend is still bullish. However, as mentioned, the price is currently in a minor retracement phase.
Therefore, crypto traders can mark the significant support levels on this chart that could possibly help the token to continue its rally.
Support – $95
Resistance- $100


