

- The Cardano coin price tests several EMA’s during intraday.
- The 24-hour trading volume is at $2.538 million.
- ADA/BTC pair is trading positive by 2.2% at 0.00003253 BTC.
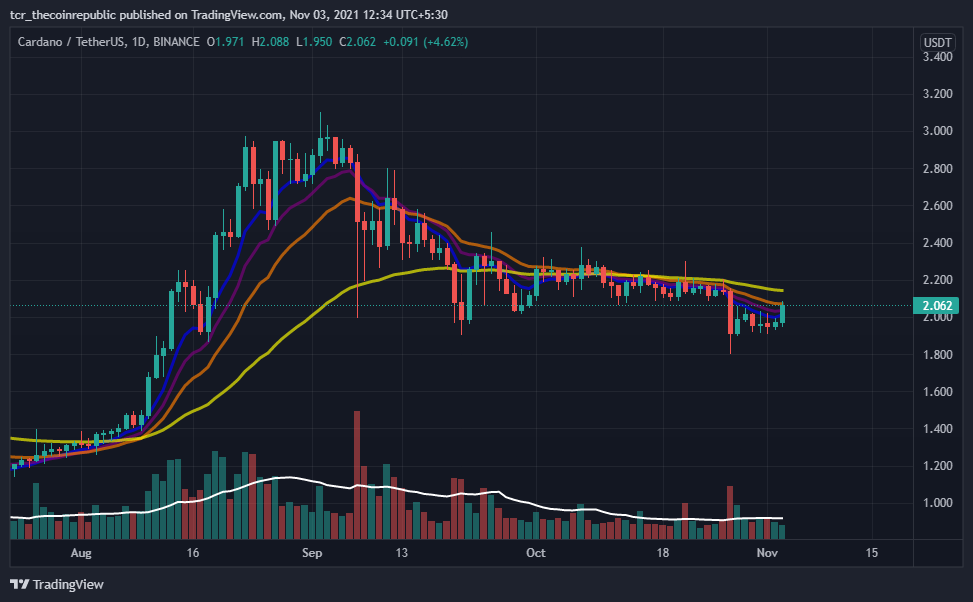
Moving Average (EMA) In the Cardano coin daily price chart containing 8,13,21,55 EMA, it is a reliable support for currency price movements. Investors can find that price moves below the yellow line and guarantee a downtrend for ADA as long as prices are below the moving average.
Trading volume (98.38 M) is close to the 20-day moving average (150.266 M). The volume is high, so the cost increases. Investors may also notice an increase in volume. This indicates that unusual volatility is common on the following trading days.


Cardano Coin Price Bulls Get Ready For The Rally
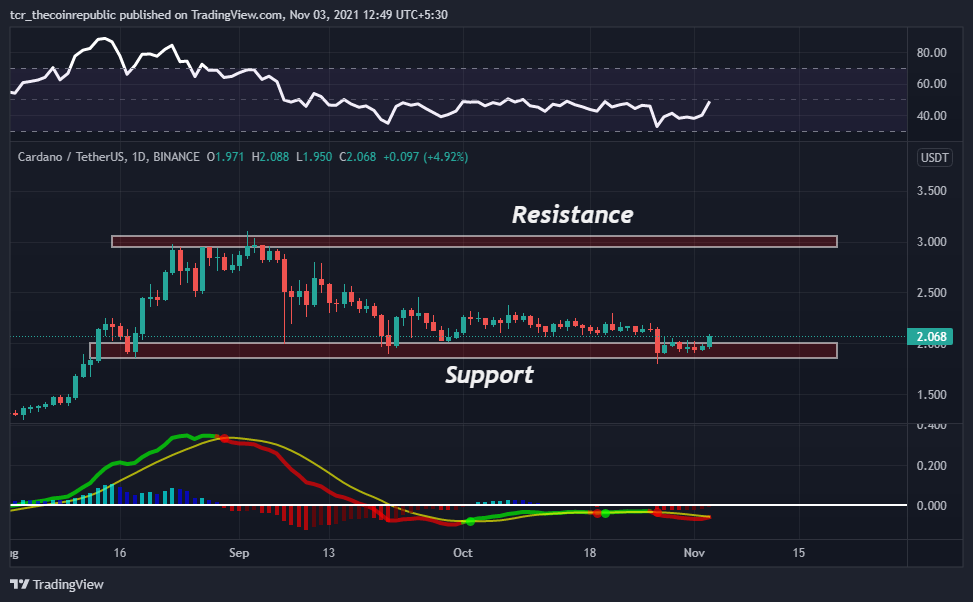
The daily price chart of Cardano coin is on the rise. Depending on the price movement, the support range is between $1.90 and $2.0. On the flip side, the resistance area you should be looking for is $2.95- $3.0.
The RSI showed a signal of 50 (bullish) with a short-term buy forecast. Investors may find that the indicator’s RSI line is sloping upside. A rise can happen on future trading days.
The MACD shows a (bearish) cross below the signal line on October 27, indicating a sell signal for the currency. In addition, investors can see the ending of red bars in the histogram indicator. A bullish cross may happen soon in upcoming trading days.
Conclusion
Cardano is currently trading at $2.04 with a 24-hour trading volume of $2,538,558,109. The ADA price has increased 4.0% in the past 24 hours. Its current supply is 32 billion ADA, and its total supply is 45 billion.
RSI and MACD indicate a buy signal. Traders have directed high volume. In fact, the cost has bounced from the support zone. A market overview also shows that this pattern will continue to surge in the coming trading days.
Resistance Level: $2.95- $3.0
Support Level: $1.90- $2.0


