

- The LRC token’s daily RSI moving in the overbought region
- The LRC/BTC pair was trading at 0.00002463 BTC, a 20.9% gain
- The daily trading volume of The LRC token is $1.18 billion, indicating a 91.34% gain
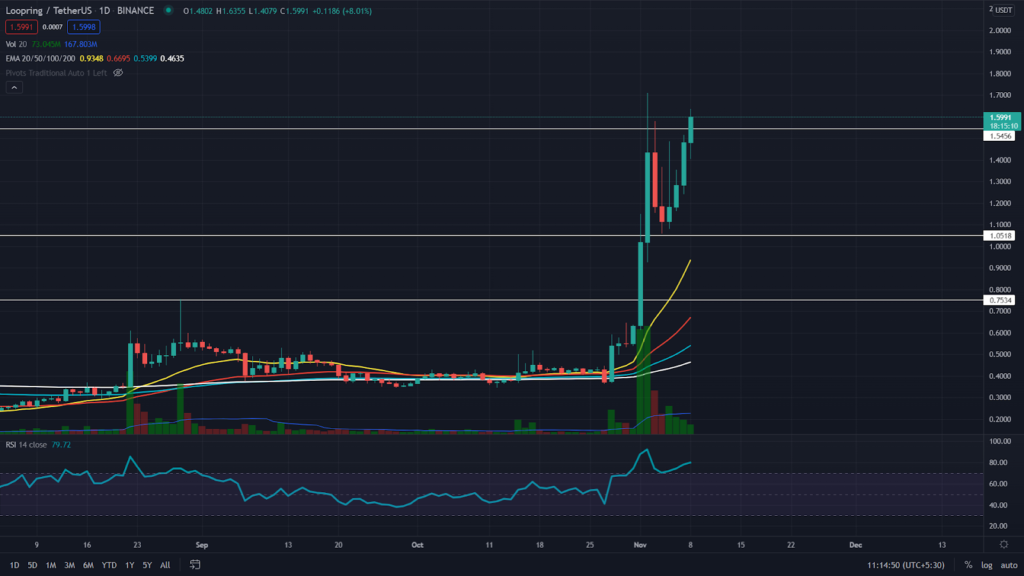
As mentioned in my previous article on loopring, the LRC token price rally was rejected from the $1.54 mark and displayed a minor retracement in its technical chart. The token price plunged to the $1.06 mark, and after obtaining proper support from this level, it started rallying towards the higher level.
As for now, the token has also managed to breach the previous All-Time High resistance, indicating a great long opportunity for crypto traders.


Concerning the EMAs, the LRC token has shown a strong rally trading above the crucial EMAs (20, 50, 100 and 200), indicating a solid uptrend in this token.
The RSI value of 80 suggests a bullish sentiment within the LRC token. However, this also indicates that the token has reached the overbought zone.
The LRC Token In The 4-hour Time Frame Chart
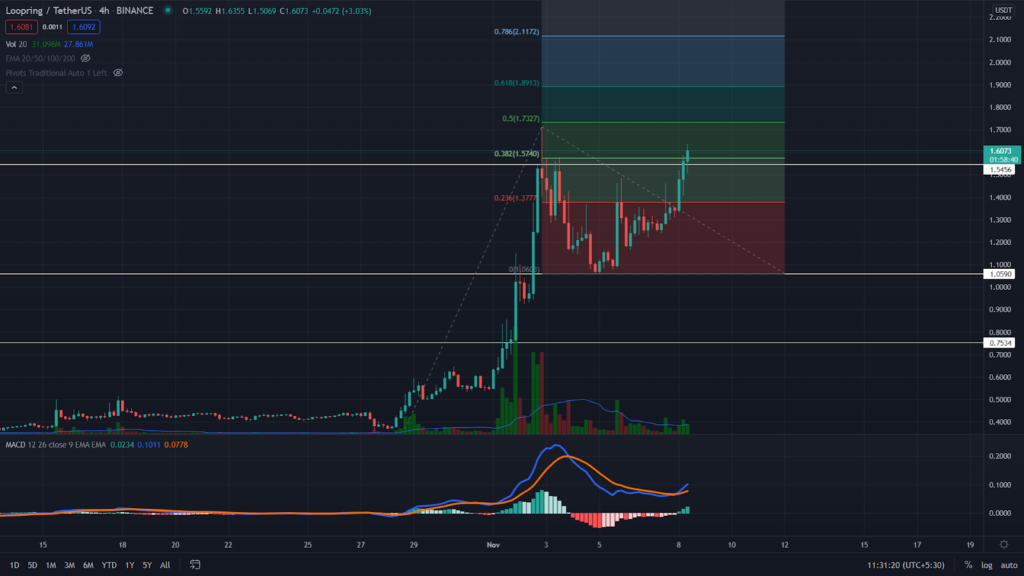
The LRC token has already provided a candle closing above the $1.545 resistance in this lower time frame chart and indicated a decent demand pressure in its retest phase. Thus, if this token manages to sustain above this breakout point; according to the Fibonacci extensions, the crypto traders can expect the nearest resistance at $1.73, followed by $19 and later $2.12
The Moving average convergence/divergence (MACD) indicator (BULLISH) shows the MACD and signal lines are moving above the neutral zone (0.00), indicating a bullish momentum in this token.
Conclusion: From a technical perspective, the overall trend for LRC tokens is strongly bullish. And as mentioned above, the token price provides a breakout from the previous ATH resistance of $1.54, indicating more potential for this Loopring token.
Support – $1.54
Resistance $1.73


