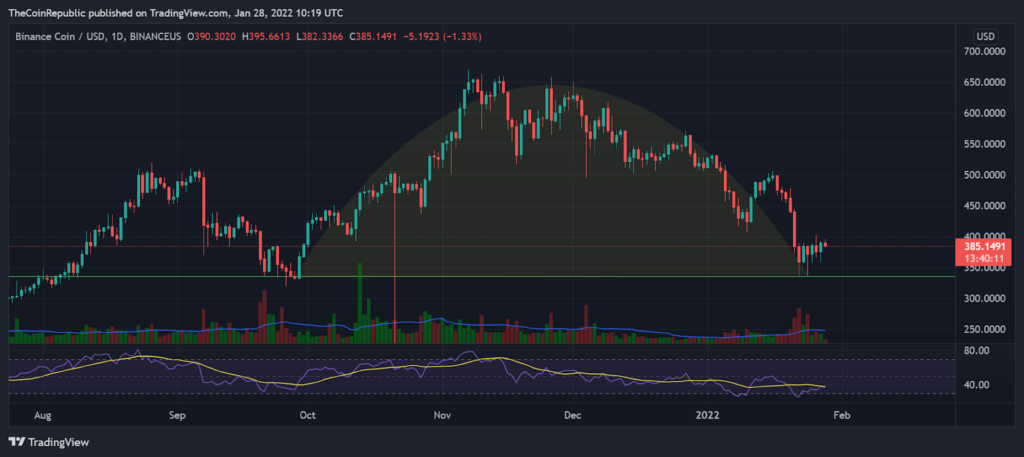
- Binance Coin is on a bullish momentum after the formation of a symmetrical arc
- RSI indicates neutrality for the coin on both hourly as well as daily charts
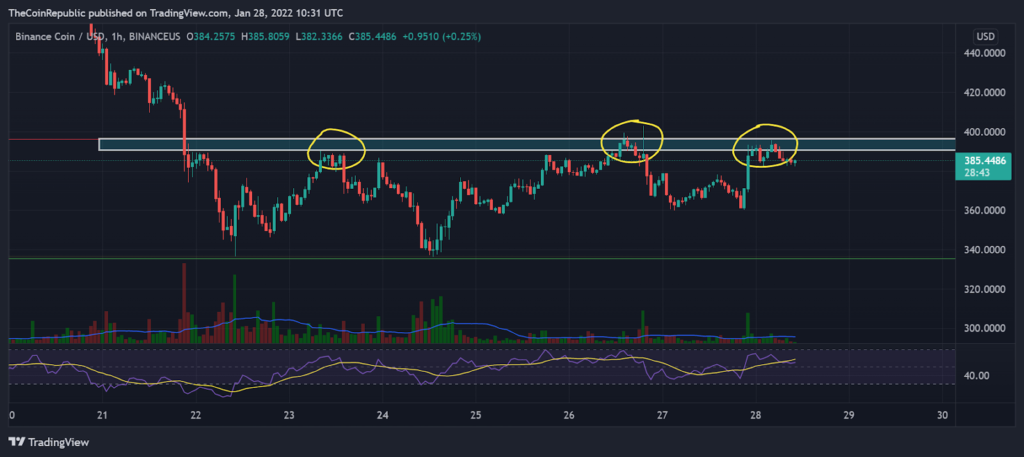
- The coin has formed a triple top with the resistance at $ 395 on the hourly chart

Binance Coin has formed an arc on the daily charts. The coin started the pattern way back at the end of September and has completer the pattern during last week. The coin has used the $ 335 zone as the base support zone for the pattern. The coin has seen increased volumes as the coin neared the completion of the pattern. The coin is showing bullish momentum after the completion of the patter. The coin could be well poised to form the handle pattern after the formation of the arc and traders need to keep an eye on the coin. The Relative Strength Index (RSI) has been indicating neutral signs for the coin.

Binance Coin has formed a triple top with the resistance zone on the hourly chart as indicated by the yellow circles on the chart. The coin has been trading in the zone between $ 335 and$ 395 over the last week and is now testing the resistance at $ 395. If the coin breaks the zone the coin could be up for a bullish takeover. The coin could also turn bearish after failing to break the resistance to continue trading in the current zone. The RSI indicator shows neutral signs for the coin. The average volumes for the coin have come down sin=gnificantly going by the volumes chart.
Conclusion:
The coin has been on a bullish reversal post the completion of the symmetric arc on the daily chart. The coin has however made a triple top on the hourly chart and could reverse its direction. Traders need to keep an eye on the coin for any directional change.
Support:$ 335
Resistance: $ 395
DISCLAIMER: The views and opinions stated by the author, or any people named in this article, are for informational ideas only, and they do not establish any financial, investment, or other advice. Investing in or trading crypto assets comes with a risk of financial loss.


