- Fantom cryptocurrency reflects a symmetrical triangle pattern in the daily time frame after resisting the $3.31 mark.
- Fantom coin drop 3.23% market Capitalization and reflecting inside a candle in the weekly time frame.
- Bitcoin pair price with FTM has fallen by 5.25% at 0.00005606 BTC and ETH pair rate dropped 3.41% at 0.0008574 ETH.

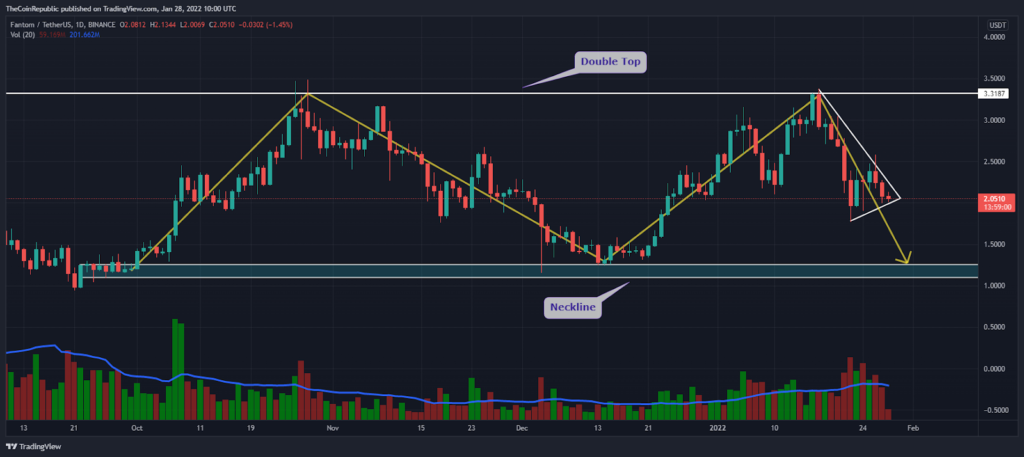
Fantom Coin appears weak after hitting the 30 days highest peak of the $3.36 mark. However, the coin tested the $3.36 level multiple times, and the sellers became aggressive; hence, FTM suggests the double top formation in the daytime frame. This indication creates a bit of nervousness in FTM coin’s holders. Near the $3.36 level price action of FTM formed a top, and $1.18 appears at the pattern’s neckline.
Fantom coin faces selling pressure in the intraday trading session by 3.23% at $2.07. However, in the past 24-hours, trading volume dropped by 41.6%, which is $1.31 billion. Fantom crypto suggests an inside candle in the weekly time frame, which is considered an undecided trend sign. In the entire cryptocurrency industry, Fantom has 0.32% market dominance. Apart from this Volume to market Capitalization ratio is 0.2489.
From the $3.36 level to till now, Fantom Coin observes the descending triangle pattern, and this channel is gradually becoming narrow. Now FTM crypto is trading near the lower verge of this triangle pattern. If investors sustain the coin above 7-days low ( $1.8 mark), the asset will probably change its trend.

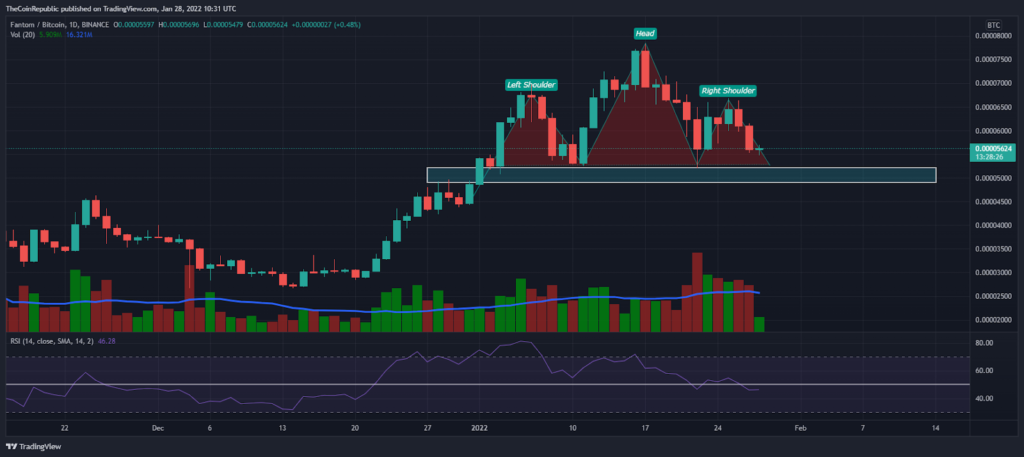
Today, the FTM/BTC pair price is slightly bearish by 5.25% at 0.00005606 BTC. Although, the price action with the BTC pair suggests a head and shoulder pattern where the 0.00006752 BTC are the shoulders and 0.00007832 is the head. The traders are approaching to reach the neckline of this following pattern (at 0.00005223 BTC).
Would Fantom Coin’s Price Breakdown the Descending Wedge Pattern?

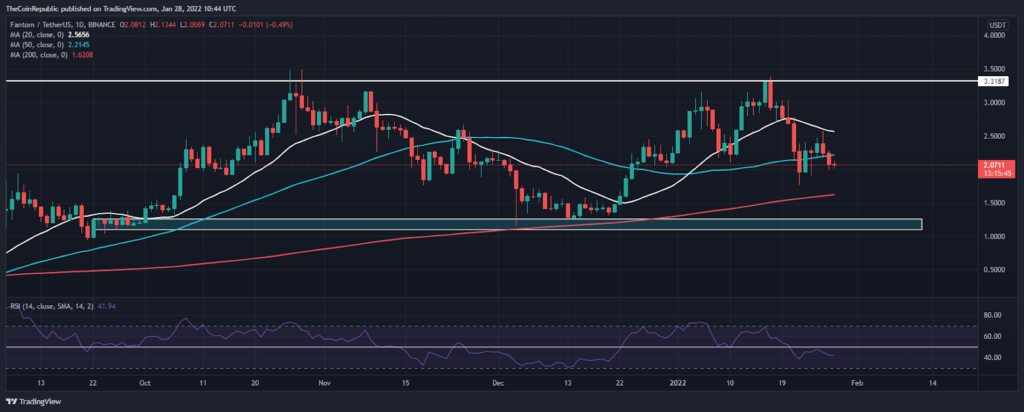
A Couple of trading sessions before, fantom crypto price started trading below the 20-day moving average, and now the coin is trading near 50 MA. If the asset continues its downwards trend, 200 MA could be the upcoming support region.
RSI indicator observing weak after breaching half-line of RSI (50 level), recently coin retested this half border. Now RSI is at the 41 mark, which could be considered bearish to the sideways territory. If the Fantom coin breaks down the descending triangle pattern, RSI would probably reach the oversold region.
Conclusion
Technical indicators reflect weakness in the Fantom coin as well as FTM/BTC pair price indicates head and shoulder pattern. If investors sustain a coin’s price above the 200 MA level, then pull up could happen; on the other hand, if investors fail, then the $1.24 mark could be the next bearish barrier.
Resistance level- $2.52 and $3.36
Support level- $1.18 and $0.58
Disclaimer
The views and opinions stated by the author, or any people named in this article, are for informational ideas only, and they do not establish the financial, investment, or other advice. Investing in or trading crypto assets comes with a risk of financial loss.


