
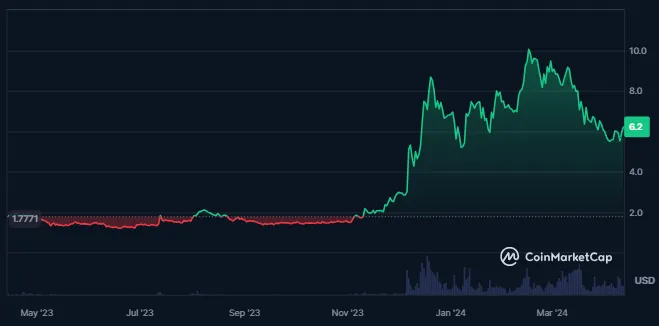
- HNT crypto price has shown only 11 green days in the last 30 days.
- The price of the Helium crypto is down by 89% from its all-time high.
Helium, a decentralized blockchain network tailored to IoT devices, was launched in 2019. Its Hotspots enable device communication and mining of HNT tokens. Co-founded by Amir Haleem, Shawn Fanning, and Sean Carey, Helium addresses IoT infrastructure issues with a proof-of-coverage consensus algorithm and a multi-token model, including HNT and Data Credits.
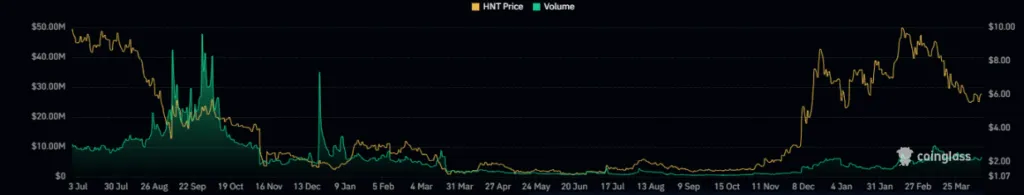
Helium has a circulating supply of 160.875M HNT, 72.14% of the maximum supply. Crypto also has a total supply of 160.875M HNT and a maximum supply of 223.0M HNT. Also, the fully diluted market cap of the crypto is $1.382B.


The market cap of the crypto has witnessed an advance of 0.36% in the last 24 hours, which has resulted in a market cap value of $997.228M. The market cap ranking of the crypto is #98, and the market cap dominance of the crypto is 0.04%.
Helium price has a high volatility of 11.81%, and the fear and greed index of the crypto is at 79, indicating extreme greed. The supply inflation of the crypto is 12.72%, and the sentiment of the crypto is neutral. Also, the crypto’s volume/market cap ratio is 1.76%.
The all-time low price recorded for the crypto is $0.2534, and the cost of the crypto has advanced by 2347% from its all-time low price. Also, the highest price ever achieved by crypto is $55.22, recorded on 13 November 2021.
The derivatives trading volume of the crypto is trading at its significant lows indicating the lack of presence of traders in the crypto. The derivatives volume further has witnessed a slight advance of 0.13% in the last 24 hours.
The long liquidation further recorded for the crypto is worth $3.17K and the short liquidation for the crypto is close to nil resulting in $2.55. Also, the long/short ratio for the crypto is 0.9128.
Price Volatility Vs Weighted Sentiment
The daily average price volatility of the HNT crypto has been very low for a long time, and there has been no significant change. The weighted sentiment of the crypto is also shallow, which shows that the crypto community is significantly less active on social media platforms.
HNT Crypto Technical Analysis
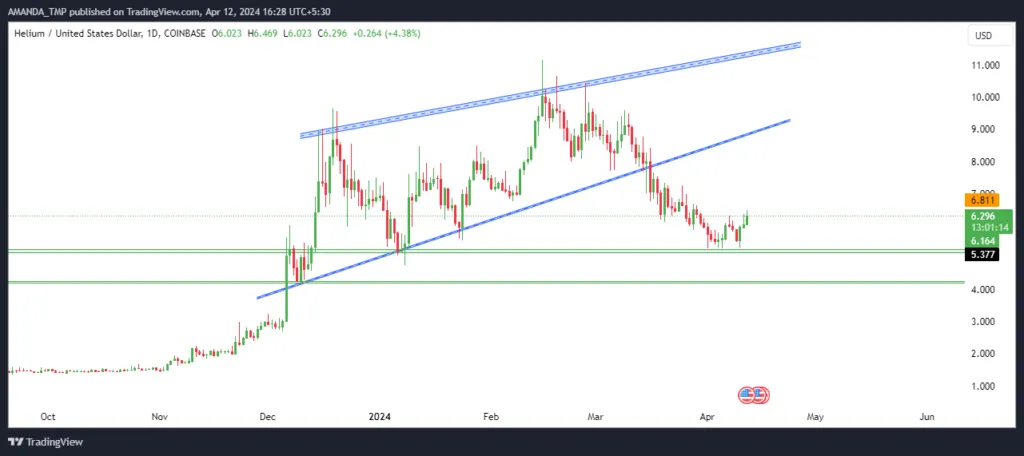
The HNT crypto was trading in a strong uptrend, and the price of the crypto was consistently advancing to higher levels. The following behavior of the crypto led to the rising wedge pattern, and the price further broke down below the pattern.
Since the breakdown in the price, the price has declined by 30% and is still following a downtrend.
HNT/USD Chart by TradingView
Although the 50-day and the 200-day EMAs are trading in a golden cross, the price of the HNT crypto has declined below the 20-day and the 50-day EMA. Moreover, the cost of the crypto has declined to a 200-day EMA, and if the price breaks further below the EMA, a further decline in the price of the crypto might be seen.
The MACD also depicts a bearish trend overall, as the MACD metrics are trading below zero. Despite this, the MACD and the signal line have formed a bullish cross, which shows a retracement of the downtrend of the crypto price.
The RSI trades are below the 50 level and have declined from the overbought zones. This also represents the declining momentum in the price of the crypto.
Summary
Helium faces a prolonged downward trend, with only 11 positive days in the last month and an 89% decline from its all-time high. Despite low social activity and minimal derivatives trading, technical analysis suggests a continuing downtrend, as indicated by a breakdown from a rising wedge pattern and bearish indicators like the MACD and RSI.
Technical Levels:
- Support levels: $4.20 and $5.20
- Resistance levels: $7.20 and $9.60
Disclaimer
This article is for informational purposes only and provides no financial, investment, or other advice. The author or any people mentioned in this article are not responsible for any financial loss that may occur from investing in or trading. Please do your research before making any financial decisions.


