

- Curve crypto price declined over 30% during the monthly trading session.
- Moving averages are suggesting bearish signals in the current phase.
- The crypto is reflecting higher liquidity in Binance, with a liquidity score of 655 out of 1000.
Launched in 2020, Curve (CRV) is a decentralized exchange (DEX) that uses an automated market maker (AMM) liquidity model. It is a decentralized finance (DeFi) phenomenon and a popular platform for stablecoins such as USDT, USDC, BUSD, DAIUSD, etc. Curve launched a decentralized autonomous organization (DAO), which uses an Ethereum creation tool, Aragon, to connect multiple smart contracts.
CRV Supply Changes, Valuation & Holdings April 2024
To date, 2.10 billion CRV tokens have been created, which is basically a total cryptocurrency supply. There are 1.19 billion tokens currently circulating in the market, covering 36.23% of the maximum supply of tokens. The Curve has a capped maximum supply of 3.30 billion CRVs.


Current market cap is ranking under the top 130 dominant cryptocurrencies in terms of market cap. The current market capitalization of Curve Crypto stands at $532 Million, and the total diluted valuation is estimated at around $1.46 Billion. The statistics reflect the deflationary nature of this project can attract public interest.
Curve Crypto currently has 85,065 token holders, and the top 3 wallets are holding 50.51% of the circulation supply. The “Curve.fi: Voting Escrow” has the highest number of tokens, 763.74 million CRVs, 36.20% of the circulation supply. Secondary comes “Binance,” which owns 167 million tokens, covering 7.93% of circulation.
Curve (CRV/USD) Technical Analysis
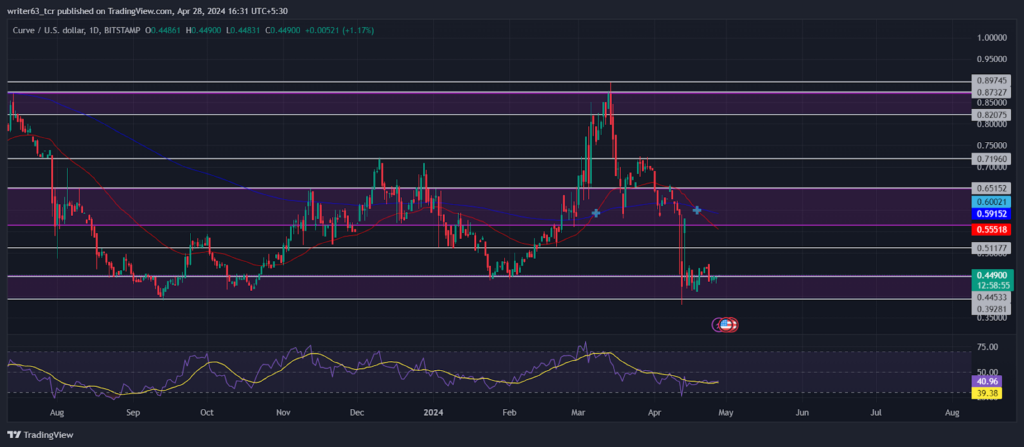
The bearish outlook lies below the key exponential moving averages, indicating bearish sentiments in terms of market technicals. The current price slipped below the 50-day and 200-day EMAs, reflecting a downtrend.
CRV price faced strong resistance from the $0.8974 supply level. The price made a bearish move and broke below the $0.5643 support level. Afterward, the price fell almost 30% on the $0.3928 extreme support level. The current price is hovering above the $0.44490 demand zone. If the price slips below the $0.3928 support, the price will fall further. On the flip side, the price can surge up to the $0.5643 level.
The relative strength index (RSI) line and the signal line are moving parallel to each other, indicating a neutral perspective over the current price. The RSI is moving at 40.96 above the signal line.
Summary
The Curve crypto price started the bullish journey in October 2023, which gained strong momentum in February 2024. The cryptocurrency recorded over 100% bullish rally from the $0.4453 demand zone. At present, CRV price is hovering above the $0.44490 demand zone. If the price slips below the $0.3928 support, the price will fall further. On the flip side, the price can surge up to the $0.5643 level.
Technical levels
- Resistance Levels: $0.5643 and $0.8974
- Support Levels: $0.4453 and $0.3928
Disclaimer
The views and opinions stated by the author or any people named in this article are for informational purposes only. They do not establish financial, investment, or any other advice. Investing in or trading crypto or stock comes with a risk of financial loss.


