

- Dogecoin crypto price is performing in a small zone.
- The price volatility of DOGE crypto is very high, resulting in 5.7%.
As per a post by @whale_alert on the X platform, a large amount of DOGE crypto is transferred from an unknown wallet to Robinhood.
🚨 🚨 200,000,000 #DOGE (30,867,144 USD) transferred from unknown wallet to #Robinhoodhttps://t.co/GkPGcKp5ym
— Whale Alert (@whale_alert) May 16, 2024
Despite this huge activity in the crypto, let’s take a look at what other factors indicate.


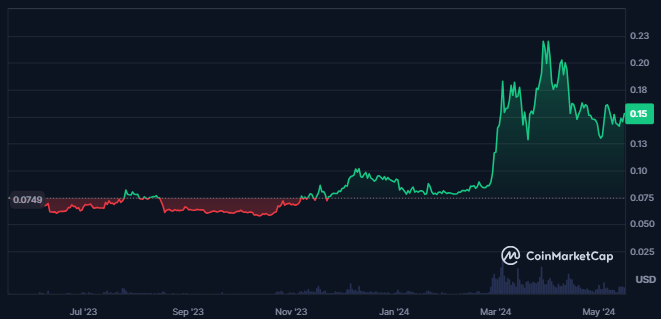
Dogecoin has an outstanding market cap dominance of 0.92% with a market cap value of $22.11B. The crypto’s market cap has been trading flat over the last 24 hours.
It has further witnessed an advance of 1.25% in 24 hours from press time. The volume of the crypto is also flat, seeing a slight advance of 5.6%. It shows that very few new traders have joined crypto.
Dogecoin Crypto Derivatives Analysis
The derivatives volume of the Dogecoin crypto has declined by 3.5% over the last 24 hours, which has resulted in a traded value of $2.53B. Despite this, the open interest has advanced by 7.5%.
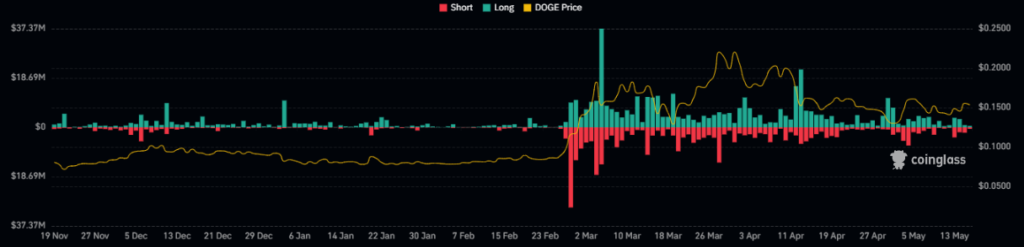
The short liquidation recorded for the crypto further is much higher, resulting in $1.96M, against which the long liquidation is just $801.63K. Also, the long/short ratio of the crypto is 0.9904.
DOGE Crypto Technical Analysis
The recent trading activity in DOGE crypto has seen a consolidation phase, with prices stabilizing within a specific range. However, a closer look at the candlestick patterns reveals a notable presence of bullish momentum.
It suggests that, despite the consolidation, the bulls are influencing and leading the price recently.
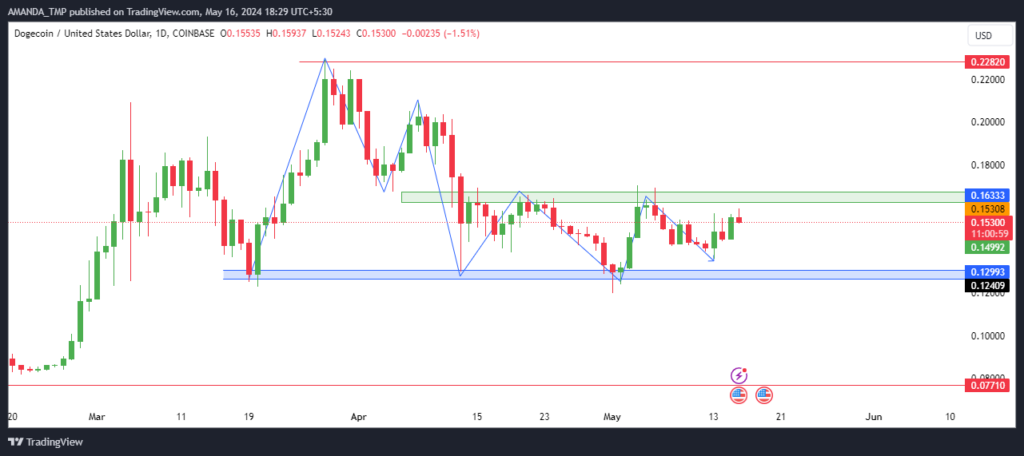
If the price of DOGE crypto manages to break above the current consolidation range and maintain its position above this level, it could signal the potential for a further surge in price.
Such a breakout would likely ignite momentum, attracting more buyers and potentially driving higher prices. In this scenario, the uptrend would likely continue, with bullish sentiment strengthening as the price advances.
DOGE/USD Chart by TradingView
The price of DOGE crypto is currently oscillating between the 50-day and the 200-day Exponential Moving Averages (EMAs). Despite this sideways movement, these EMAs have formed a golden cross, indicating a prior dominance of bullish sentiment in the market.
If the price successfully closes above the 50-day EMA on the daily timeframe, it could trigger a surge in price, potentially accompanied by robust momentum. This event would likely attract further buying interest, driving the price higher.
However, the MACD metrics present a level of uncertainty in the crypto trend, as they are trading in the negative zone. Despite this, the indicators’ metrics show a bullish crossover, suggesting a potential shift in momentum towards the upside.
Meanwhile, the Relative Strength Index (RSI) is subdued, trading below the 50 level. Any surge in price above this median level could lead to an increase in momentum for the crypto price. Traders should monitor these technical indicators closely to gauge the potential direction of DOGE crypto in the near term.
Summary
Despite a large DOGE transfer to Robinhood, market indicators suggest uncertainty. A stable market cap and flat volume imply limited trader engagement. While bullish signals exist, MACD negativity and RSI below 50 indicate price ambiguity. Traders should cautiously assess DOGE’s potential amidst mixed technical signals.
Disclaimer
This article is for informational purposes only and does not provide any financial, investment, or other advice. The author or any people mentioned in this article are not responsible for any financial loss that may occur from investing in or trading. Please do your research before making any financial decisions.


