

- The ETH crypto price is gaining momentum, leading to an advance in price.
- The price volatility of the crypto is well balanced, resulting in 3.35%.
Ethereum is a decentralized blockchain platform enabling smart contracts and dApps. Its native cryptocurrency, Ether (ETH), powers transactions and serves as a digital asset.
Created by Vitalik Buterin, Ethereum supports DeFi, NFTs, and DAOs. The Merge transitioned Ethereum to a proof-of-stake mechanism, enhancing energy efficiency, security, and scalability.


An advance in the trading activity of the Ethereum crypto has been seen over the last 24 hours. It is followed by an advance of 23% in the trading volume of the crypto.
Followed by an advance in the trading volume, the crypto’s market cap has also advanced by 5.1%. This results in a market cap of $371.787B, and the market cap dominance of the crypto is 15.23%, representing a solid market presence.
Blockchain Data Overview Of Ethereum Crypto
The stablecoin market cap of the Ethereum crypto has been consistently rising over the last few days. It is further followed by a surge in the Total Value Locked for the crypto.

Despite the surge in the explained crypto factors, Ethereum’s fees have declined over the last few days. Also, at press time, the Total Value Locked of the crypto is $54.95B.
Moreover, the stablecoin market cap of the crypto is $80.917B, and the value of the treasury of the crypto is $963.83M.
ETH Crypto Shows Signs Of Bullishness; What Should Be the Action Plan?
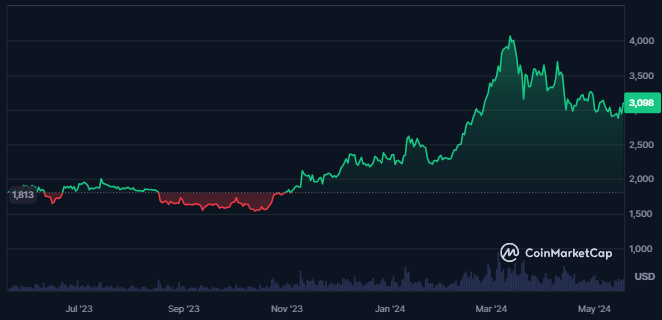
ETH crypto price has been following a downtrend for more than two months, which has led to a decline of 30% in its price from the swing high of $4093.88.

Press time price action shows the price of the ETH crypto trading inside a falling wedge pattern and the breakout of an inside candle pattern on the daily chart.
If the crypto price continues to rise and breaks above the wedge pattern, then one can aim for targets of $3700 and $4080 as these are the crucial resistance levels situated at the highs of the pattern.
ETH/USD Chart by TradingView.com
EMAs on the daily chart of the ETH crypto are trading in a golden cross. The cryptocurrency’s price currently trades at the 50-day EMA on the daily chart. If the price breaks above the EMA, it might lead to higher levels.
The MACD and the signal line are trading in a bullish cross, while its metrics are trading in negative territory. It gives a neutral sign for technical analysts. The RSI has recently broken above the 50-level, trading at 52.05 at press time. It further has also broken above the 14-day SMA.
Summary
Ethereum (ETH) is showing bullish signs, trading within a falling wedge pattern with potential targets of $3700 and $4080.
A 23% surge in trading volume and a 5.1% increase in market cap bolster its strong market presence. Technical indicators suggest potential further gains if resistance levels are breached.
If the price of the Ethereum crypto fails to sustain the higher levels, it might take support at the levels of $2630 and $2825.
Disclaimer
This article is for informational purposes only and provides no financial, investment, or other advice. The author or any people mentioned in this article are not responsible for any financial loss that may occur from investing in or trading. Please do your research before making any financial decisions.


