
- The XRP crypto has an outstanding market presence, followed by a market cap dominance of 1.16%.
- XRP was outperformed by 74% of the top 100 crypto assets in the last 1 year.
XRP, the native asset of the XRP Ledger, is designed for rapid, environmentally friendly financial transactions. Created by Jed McCaleb, Arthur Britto, and Chris Larsen, XRP’s supply was fully distributed at its inception.
Ripple promotes XRP for cross-border liquidity through RippleNet, collaborating with major financial institutions to enhance global payments.


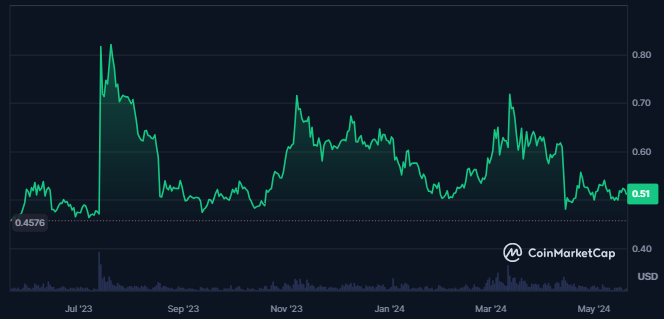
The market cap of the XRP crypto has been trading flat over the last 24 hours, while the traded volume has witnessed a surge of 64%. This shows an advance in crypto trading activity.
What Do Derivatives Say About XRP Crypto?
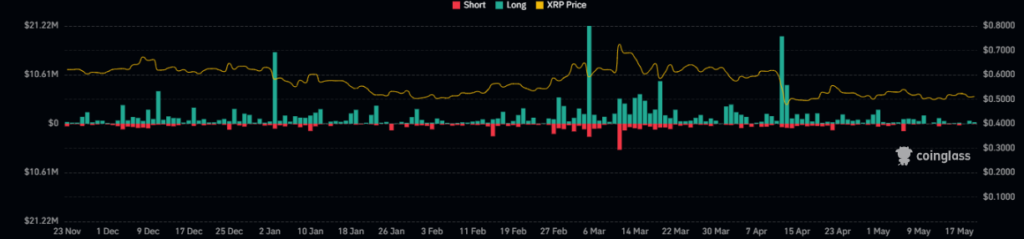
Higher long liquidations over a period can be seen on the liquidation chart of XRP crypto. This showed sellers ruling over the price.
The derivatives volume has further witnessed a surge of 50% over the last 24 hours, while the options volume has declined by 46%. It showed that future activity has advanced while the traders are stepping away from the XRP option contracts.
Moreover, the long liquidation for the crypto is worth $762.67K, and the short liquidation is $74.52K, as recorded in the last 24 hours. That resulted in a long/short ratio of 0.9365.
XRP Crypto Technical Analysis
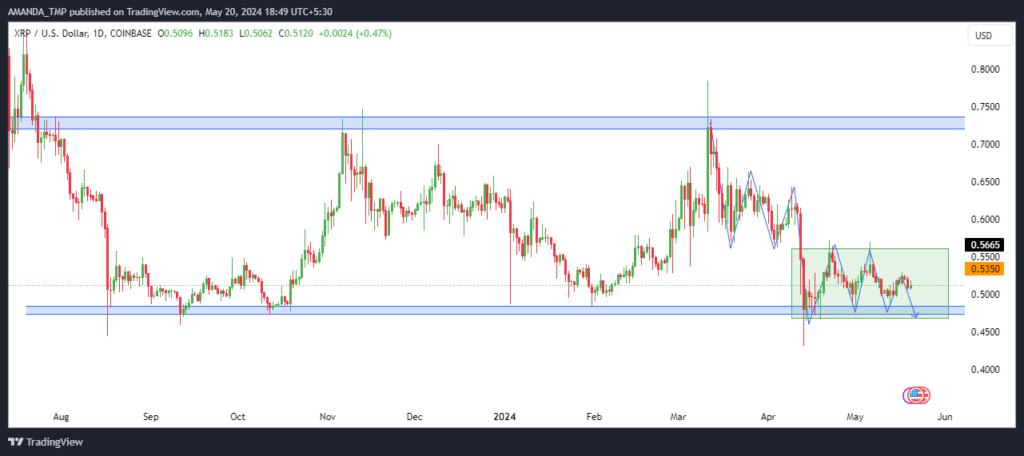
During the daily timeframe, XRP’s price traded within a parallel wedge pattern, having sustained this formation for over 250 days. This pattern suggested a prolonged period of consolidation and uncertainty in the market.
A closer analysis of the charts revealed strong bearish candlesticks dominating the daily chart, while the bullish candles are notably smaller. This disparity indicated a prevailing bearish sentiment among traders.
Additionally, the XRP price was hovering around the lower band of the EMA, underscoring the sellers’ dominance. This positioning suggested a higher likelihood of continued downward movement in the cryptocurrency’s price.
XRP/USD Chart by TradingView
The technical indicators reinforced the weakness in XRP’s price movement. Notably, the 50-day and 200-day EMAs exhibited a death cross, a bearish signal indicating potential further declines.
Furthermore, the XRP price has dropped below both EMAs, reflecting a sustained downtrend. Both the crypto’s price and the EMAs were trending downward, underscoring the persistent bearish sentiment in the market.
The RSI also indicated volatility as it revolves around the level of 50 and the 14-day SMA levels.
Summary
XRP was in a strong downtrend, trading within a parallel wedge pattern for over 250 days.
Dominated by bearish candlesticks and sustaining below the EMAs, XRP exhibited continued seller dominance.
The 50-day and 200-day EMAs’ death cross and long liquidations indicated persistent bearish sentiment and further decline potential.
Moreover, the support levels for the XRP are $0.20 and $0.40, and the resistance for the crypto is $0.640 and $0.780.
Disclaimer
This article is for informational purposes only and does not provide any financial, investment, or other advice. The author or any people mentioned in this article are not responsible for any financial loss that may occur from investing in or trading. Please do your research before making any financial decisions.


