

- The KAS crypto price has traded in green for 15 days in the last 30 days.
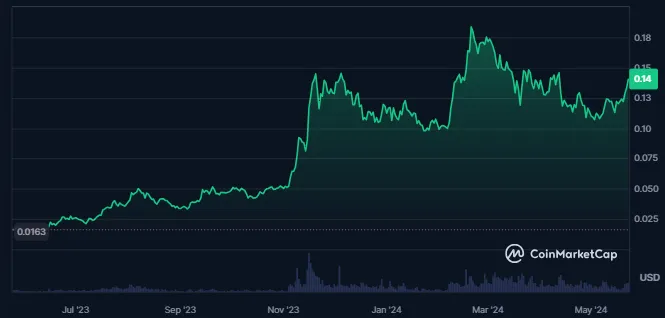
- The KASPA crypto price has outperformed 93% of the top 100 crypto assets in the last 1 year.
Kaspa (KAS) is a proof-of-work cryptocurrency utilizing the GHOSTDAG protocol for a blockDAG architecture, enabling instant transaction confirmations and high block rates.
Created by Yonatan Sompolinsky, Kaspa offers secure, scalable, and decentralized transactions without pre-mining, which is ideal for everyday use with rapid block intervals.


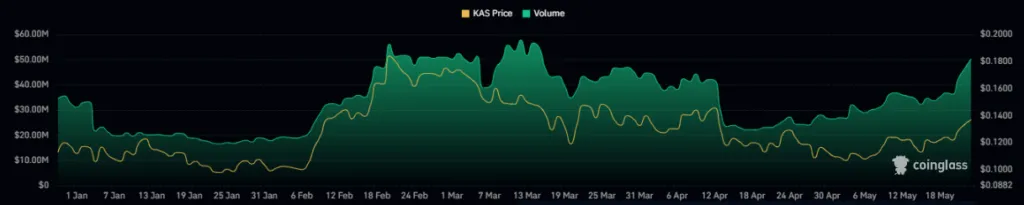
When writing, the price of the Kaspa crypto has advanced by 2.9% in the last 24 hours. The trading volume for the crypto has also advanced by 34%. It shows an advance in the number of traders in the crypto.
At the time of writing, 82.6% of the maximum crypto supply is circulating in the crypto market. Moreover, the total supply is 23.715B KAS, and the fully diluted market cap of the Kaspa is $4.034B.
Kaspa Crypto Derivative Analysis
The trading volume of the crypto has been advancing over the last few days, which shows a rise in the interest of traders in Kaspa crypto.
The derivatives volume for the crypto has advanced by 15.4%, resulting in a traded value of $62.36M. The open interest in the crypto has also advanced by 8.9%.
Long liquidation recorded for the crypto over the last 24 hours is higher, resulting in $28.53K. Also, the short liquidation for the Kaspa is worth $16.69K.
KAS Crypto Technical Analysis
The price of the KAS crypto has broken above the falling wedge pattern and is advancing to higher levels with strong momentum.
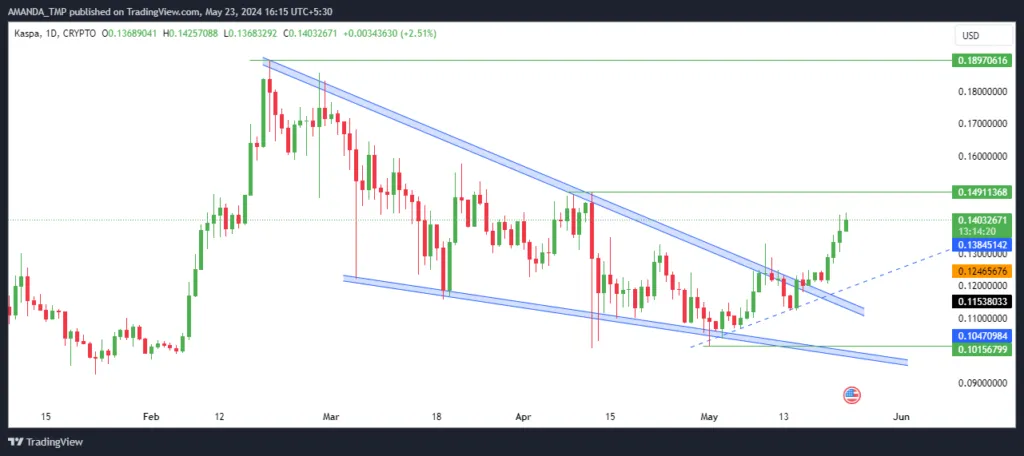
The price of the KAS crypto was declining from the swing of $0.1896 formed on 20th February 2024. A lower low swing on the daily chart followed that price decline.
The following price behavior of the crypto led to the formation of a falling wedge pattern, and the price of the crypto further broke above the pattern with strong volume.
KAS/USD Chart by TradingView on
The 50-day and the 200-day EMAs exhibit a bullish character as the crypto’s price has advanced above the given EMAs. Also, the EMAs on the daily chart of the crypto are trading in a golden crossover.
The MACD indicator is also supporting the bulls, as the histograms on the chart are strongly bullish. The MACD and the signal lines have also advanced above the zero level.
The RSI is rising to higher levels with solid momentum and is about to hit the overbought zone. It also has broken above the 14-day SMA and has sustained above the 50-level.
Summary
Kaspa (KAS) shows bullish potential with a 2.9% price increase and a 34% rise in trading volume in the last 24 hours.
Breaking above a falling wedge pattern, with strong EMA, MACD, and RSI indicators, Kaspa’s momentum and trader interest suggest a possible 30% price surge from its current market position.
The support levels of the KAS crypto are $0.0760 and $0.1010, and the resistance levels are $0.1490 and $0.1890.
Disclaimer
This article is for informational purposes only and does not provide any financial, investment, or other advice. The author or any people mentioned in this article are not responsible for any financial loss that may occur from investing in or trading. Please do your research before making any financial decisions.


