
- Cardano coin consolidates near the psychological level of $3.00 mark after a strong bull run from the lower levels.
- The price is trading above all vital moving averages of 20, 50, 100, and 200-day lines, whereas 20 and 50-day lines can give support in the short term.
- The pair of ADA/BTC is trading at 0.00005832 BTC with a minor intraday drop of -0.14%, and the ratio of ADA/ETH is CMP at 0.0008166 ETH with a profound intraday loss of -6.18%.
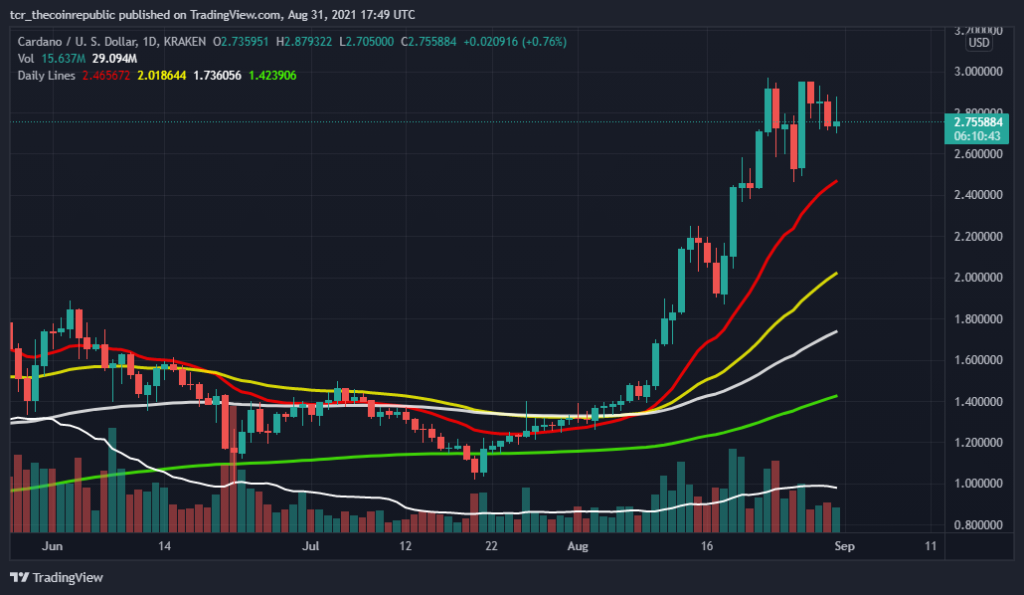
Cardano coin at the monthly chart is projecting some signs of weakness at the higher side, as the token is facing rejection near the $3.00 mark. At the same time, the coin fails to break the psychological hurdle of $3.00 levels and faces a pullback from the higher side.
ADA token is now consolidating near the $3.00 mark, and if it fails to suppress it, we can see some pullback from current levels. Presently, the coin is trading above all vital moving averages of 20, 50, 100, and 200-day lines. In comparison, 20 and 50-day lines can be considered as primary support lines on the lower levels. Volume activity is another primary concern for traders or investors, which is quieter and needs to grow more for positive reversal. Support on the lower side is now at $2.46 and $2.02. At the same time, resistance on the higher side is around $3.00 and $3.19.


Cardano coin at the weekly chart is ready to showcase a bearish trend
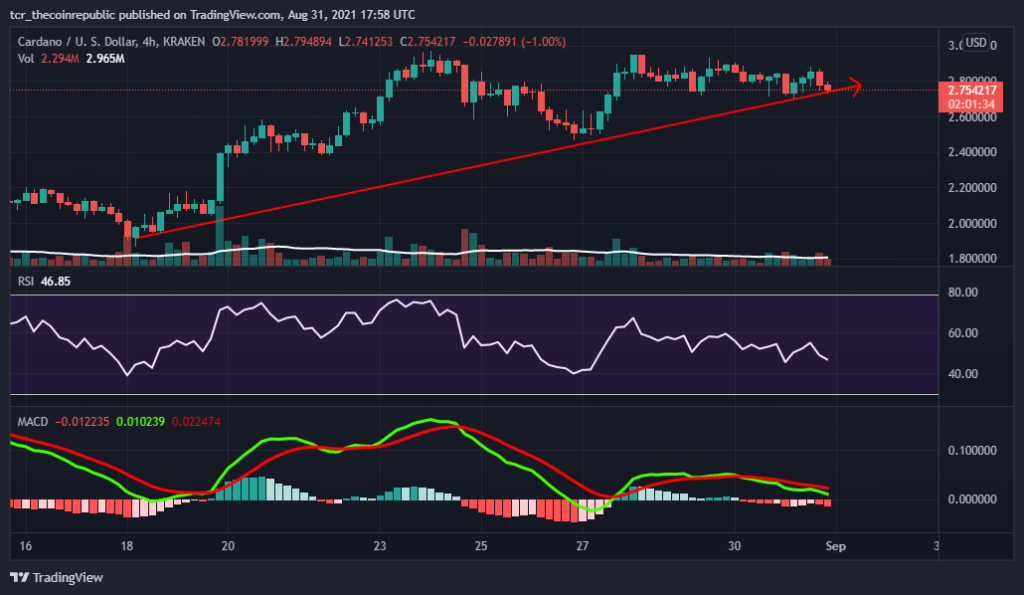
Cardano coin at the weekly chart is ready to showcase a bearish trend as the token trading near the support line. In contrast, the technical parameters are also favoring the bears in the short-term trading sessions. Moreover, the coin heading is lower, and the volume on the weekly chart is lower, which creates uncertainty for either side. Presently, the Cardano coin is trading at $2.75 with a 24-hour loss of -2.09%, and the volume to market cap ratio is 0.06221. However, the medium to long-term trend is still bullish over the monthly charts.
Relative Strength Index (BEARISH): Cardano coin RSI indicates a caution trend over the weekly chart but is now heading towards the lower zone. In contrast, the RSI trades near the oversold zone after falling from the higher levels CMP at 47.
Moving Average Convergence Divergence (BEARISH): This indicates a bearish trend on the daily chart with a negative crossover. The seller’s line (orange) is overpowering the buyer’s signal line (blue), with no sign of recovery.
Support levels: $2.46 and $2.02
Resistance levels: $3.00 and $3.19.


