
- PHOENIX’s stock price is currently trading at $544.
- PHOENIX stock is in a downtrend, making a sequence of higher lows.
Phoenix Group is a financial company that provides pension, Life insurance, Investment in ETFs, and retirement planning services, such as financial advice and guidance.
Will Phoenix Continue its Downtrend ?
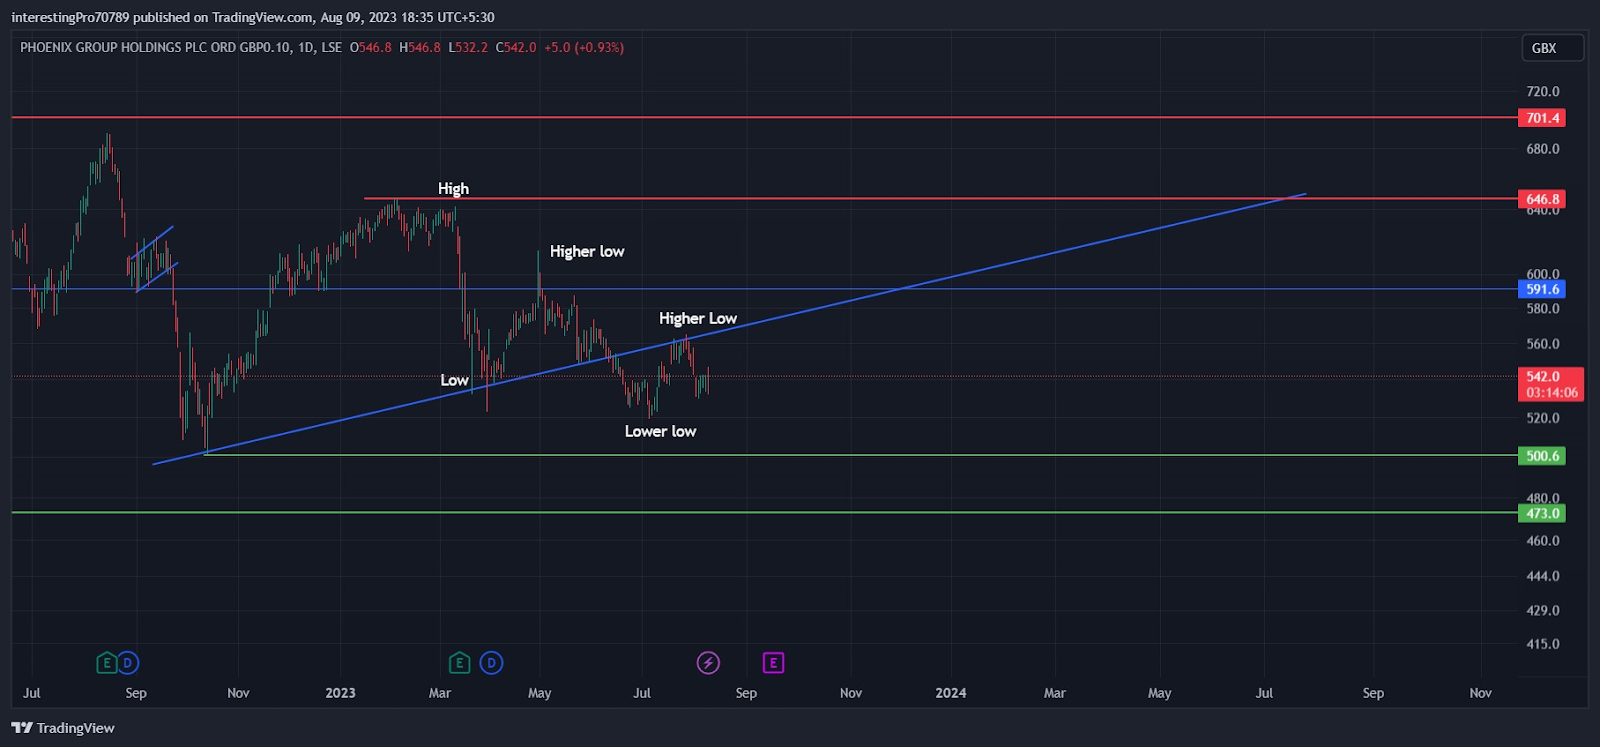
In August 2022, Phoenix Group’s price faced significant rejection at $701.4, resulting in a more than 35% drop. However, by October 2022, PHNX Stock price formed a solid support at $500 and rallied to $646.8, nearly recovering the previous loss. This strong rebound highlighted buyer presence at the $500 level. Subsequently, the price was met with resistance at $646.8, leading to a sharp decline. After bouncing off a trendline support, the price faced resistance at $591.6 and started to fall again, forming a lower high.


Recent price action shows a retest of the trendline, but with weaker buying momentum compared to before. Sellers are currently dominant, potentially driving the price down to the critical $500 support. This level holds importance due to its historical buyer activity. If the price fails to hold above $500, it might continue its downtrend toward $473 support. However, if the price maintains support above $500, buyers could drive it higher, targeting the $591.6 resistance level.

The 50 EMA (yellow line) is at $548.2 and the 200 EMA (red line) is at $575. PHNX Stock price is currently trading below both EMAs, which indicates the bearish sentiments or seller control in the current scenario.

The relative strength index RSI is at 48.67, which shows that the price is in neutral territory, facing pressure from both buyers and sellers.
The Supertrend indicator suggests that the current sentiment of the Phoenix Group chart is bearish, as the price is trading below the trendline. A shift to a bullish sentiment would only occur if the price manages to close above the red line.
Conclusion
In conclusion, the Phoenix Group chart exhibits a bearish trend with sellers having the upper hand and forming a higher low pattern. The pivotal $500 support level holds significant importance for determining future price movement, as strong buyer presence is observed at this level. If buyers manage to sustain the price above $500, they could potentially regain control, while a breakdown of this support could allow sellers to continue dominating. The indicated technical indicators align with a bearish outlook at present. Despite this, the company’s previous positive earnings reports and anticipated positive future reports might influence a shift from bearish to bullish sentiment in the market.
Technical levels
Resistance levels: $591.6.
Support levels: $500 and $473.
Disclaimer
The views and opinions stated by the author, or any people named in this article, are for informational purposes only. They do not establish financial, investment, or other advice. Investing in or trading crypto assets comes with a risk of financial loss.


