
- The WMT stock price is trading at a 52-week high level.
- HSBC has given a buy rating to the stock for a target price of $200.
- The company’s revenue is increasing gradually year on year.
Market Capital of Walmart – $435.818 Billion
Current market price of Walmart – $161.92


Walmart Stock Overview
In the previous trading session, the price of Walmart’s stock fell by $1.99, with a decline of 1.21%. The stock is trading in a rising channel pattern where the resistance for the stock is currently present near the level of $167. If we talk about the support level, then it is present near the level of $159.
Walmart’s revenue has steadily risen over the years as the revenue in 2016 was $485.14 Billion, which now stands at $611.29 Billion. The revenue has risen yearly, a good sign for the stock’s future. The company’s net income is unstable as the net income keeps increasing and decreasing year on year.
The company’s net debt is vast, standing at $50.30 Billion. The company needs to take some corrective action to reduce the overall debt of the company. The rating firm HSBC has rated the stock a buy rating for the target price of $200.
Technical Analysis of Walmart (WMT) Stock
The Walmart chart is in the uptrend as the price has surged by over 3.15% in a month and 19.55% in a year. The price has formed a trendline support to push the price up, and the trendline is currently present near the level of $147. The stock price has surged steeply, which can initiate some selling pressure over the stock.
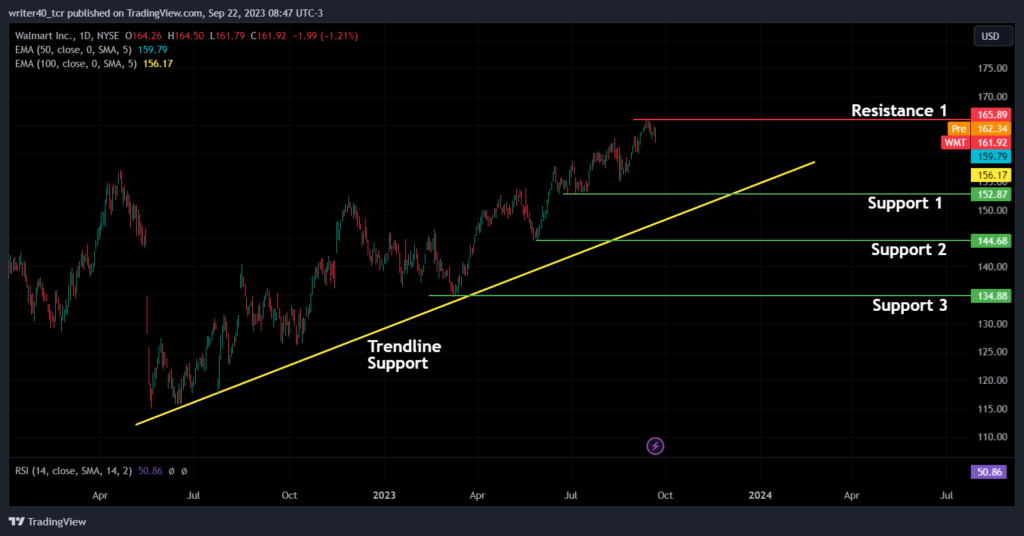
Walmart Stock has formed several support levels during its upward journey. The recent support created by the stock is present near the level of $152.87, which is drawn as Support 1. Then, the 2 other support levels are present at $144.68 and $134.88 levels, named Support 2 and Support 3 on the chart. The only resistance level present for the stock is near its recent high of $165.89.
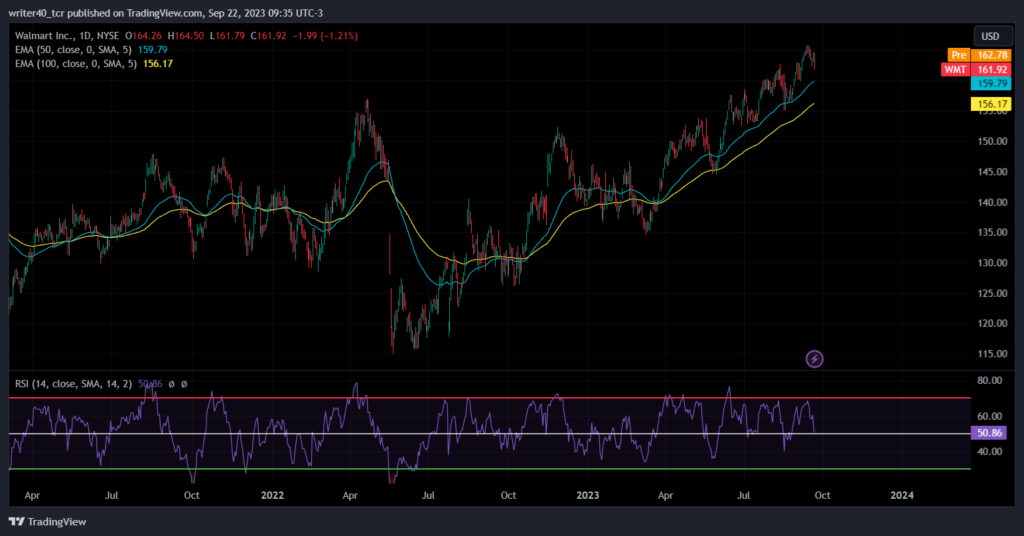
The price trades above the critical Exponential Moving Averages of 50 and 100. It has respected the EMAs and rebounded remarkably from that. The EMAs are near the $156.17 and $159.79 levels, which can act as crucial support for the price. The slope of the EMA is more than 30 degrees. It indicates that the price is in a super bullish trend. Although the RSI is just above 50 and falling sharply, it indicates that the buyers are losing momentum.
Conclusion
The overall momentum and trend of the stock are bullish, and the price is trading at its all-time high levels. The Rating agency HSBC has also rated a buy signal for the stock with a target of $200, which will boost the price. If the stock breaks the resistance level, the price will reach the $200 level.
But the price looks stretched, so that a minor correction will be good for a stable upward move.
Technical Level
Resistance – $165.89
Support – $152.87 and $144.68
Disclaimer
The views and opinions stated by the author, or any people named in this article, are for informational purposes only. They do not establish financial, investment, or other advice. Investing in or trading crypto assets comes with a risk of financial loss.


