

- In the last five days, WMT stock has advanced by more than 3%.
- Walmart Inc. is worlds one of the most famous hypermarket chains.

Walmart Inc. is one of the most popular retail corporations that operates a chain of hypermarkets. It runs discount department stores and grocery stores in the U.S. It has its headquarters in Bentonville, Arkansas. The company was founded by Sam Walton and James Bud Walton in 1962 and has more than 10K locations worldwide. It is traded as a WMT ticker on the New York Stock Exchange.
The WMT stock has yielded a dividend of 1.56% in the year 2022 and has a payout ratio of 52.43%. This resulted in a total of $2.24 as a dividend in the following year on each share. The annualized 5-year growth of the dividend is 1.82% in Walmart Inc. and 3.11% in the industry.


WMT stock has an EPS of 5.22 USD which means that the company is making $5.22 on each share. Currently, the stock has a total of 1.429B shares floating in the market and the beta of the stock is 0.58. This indicates that the returns of the WMT stock are stable and less volatile than the market as a whole.
Walmart Inc. Stock Performance Analysis

Walmart Inc. incurred operating expenses of $123.04B in the year 2022 and reported a revenue of $611.29B. This follows a net income of $11.68B which is 1.91% of the profit margin. Walmart Inc. also reported a huge debt of $58.92B in the year ending 2022 but this is decent as compared to its revenue.
Option Chain Of WMT Stock

Looking at the derivatives data of the WMT stock we can see that the put OI is slightly higher than the call OI. This has resulted in a put/call volume ratio of 0.91. The total call volume of the stock is 13.7K and the put volume is 12.52K.
Fast Momentum In WMT Stock Price, Will This Be Continued Further?
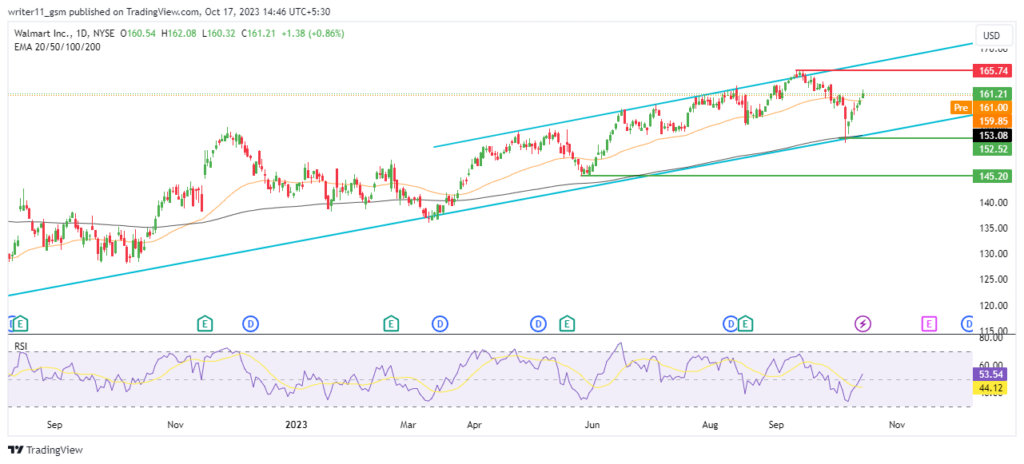
The WMT stock is following an uptrend and has been sustaining above a dynamic trendline for more than one year.
The stock also is currently trading inside a rising wedge pattern and a breakdown below the pattern can lead to a huge decline in price. This phenomenon can occur due to a very reliable dynamic trendline holding the price for more than a year will be broken.
The EMAs are following a golden cross, also the WMT stock price has advanced above the 200-day EMA and the RSI has broken above the level of 50. It also has broken out above the 14-day SMA.
Conclusion
Walmart Inc. has been showing sustainable financials throughout the years. It has maintained its revenue and is also profitable. The share price of the WMT stock is also sustaining above the dynamic trendline. The indicators are also giving bullish signals for the stock.
Therefore, we can witness higher prices in the stock in the upcoming days. Also if the WMT stock breaks below the level of $150.00, it can change the trend in bearish. This might lead to a huge decline in the price of the share.
Technical Levels
- Support levels- $145.00 and $152.00
- Resistance levels- $165.00 and $180.00
Disclaimer
The information provided in this article, including the views and opinions expressed by the author or any individuals mentioned, is intended for informational purposes only. It is important to note that the article does not provide financial or investment advice. Investing or trading in cryptocurrency assets carries inherent risks and can result in financial loss.


