

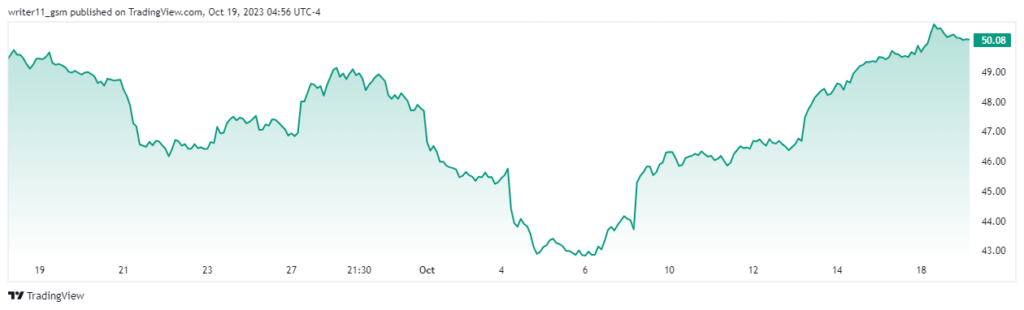
- The DVN stock price has advanced by 5.99% in the last five days.
- The PE ratio for Devon Energy Corporation stock is 6.83.
Devon Energy Corporation (NYSE: DVN) is an American Oil & Gas production company that is engaged in hydrocarbon exploration in the United States. It was founded in the year 1971 by John Nicholas and his son, and it has its headquarters in Oklahoma City. The current CEO of Devon Energy Corporation is Richard E. Muncrief and the company has 1.8K employees.
The 52-week range of DVN stock is $42.59-$75.08, along with a beta of 1.52, which makes the stock slightly more volatile than the overall market. The market cap of Devon Energy Corporation is $32.086 Billion. The company also yielded a dividend of 8.23% in the year 2022, with a payout ratio of 55.46.


Devon Energy Corporation Stock Performance Analysis
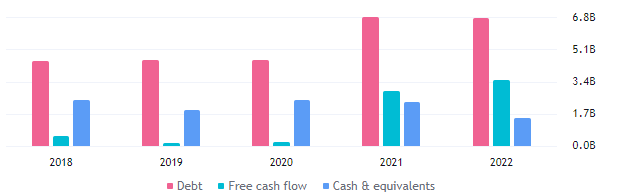
On the debt chart, it can be seen that the debt of the company suddenly advanced in the year 2021, resulting in $6.76 Billion, and furthermore, the recorded debt for the year 2022 is $6.72 Billion. The free cash flow of the company has also suddenly advanced from millions to billions in the year 2022, which indicates that the company has expanded its business.
Analyst Rating for DVN Stock
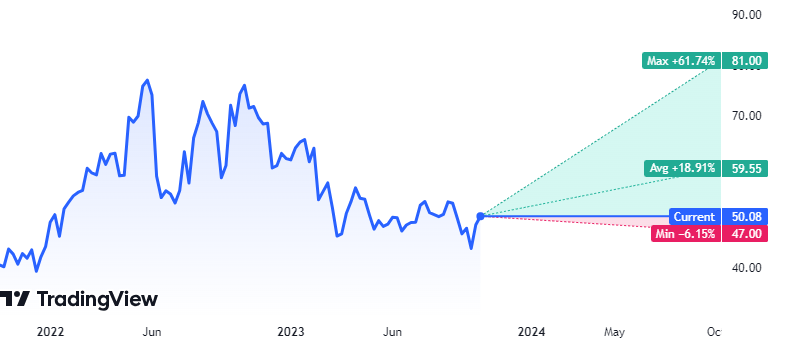
Devon Energy Corporation met the estimated revenue targets given by the experts over the years. The experts of Tradingview are highly bullish on the stock, aiming for long-term targets higher than 50%. The expected target for DVN stock is $81.00, and it is currently trading below its average price.
Fast Advance in DVN Stock Price; What is Coming Next?
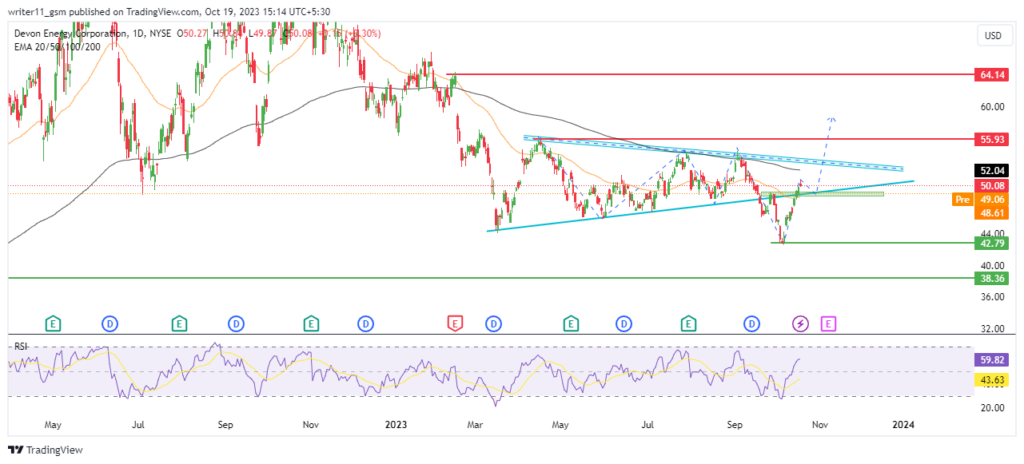
After consistently following an uptrend and advancing to higher levels, DVN stock made a swing high of $79.40 on 10th June 2022. From this level, the stock started to face a decline in price and hit the low of $42.73 a few days ago. The stock price declined by 45% in over a year.
The DVN stock price led to the formation of a symmetrical triangle pattern and the price also broke down below it. In the daily timeframe, the stock price has advanced to higher levels with very fast momentum. The stock price has also broken out above the previous swing high. This indicates the change toward a bullish sentiment for DVN stock.
The 50-day and the 200-day EMAs are forming a death cross pattern on the charts. Despite this, the stock price has advanced above the 50-day EMA on the daily charts. This could be a sign of a sudden change in trend.
On the daily chart of DVN stock, the RSI is getting bullish as it has crossed above the level of 50. It has also broken above the 14-day SMA and both the oscillators are following an uptrend.
Conclusion
Devon Energy Corporation is showing signs of improving financial performance, with increased revenue and notable growth in free cash flow. On the charts, the stock price has broken above the previous swing high, indicating an uptrend. The RSI also suggests bullishness, and the stock has moved above the 50-day EMA. If the DVN stock price maintains itself above the $50.00 level, there’s potential for further gains in the stock price.
Technical Levels
- Support levels- $38.00 and $42.00
- Resistance levels- $56.00 and $64.00
Disclaimer
The information provided in this article, including the views and opinions expressed by the author or any individuals mentioned, is intended for informational purposes only. It is important to note that the article does not provide financial or investment advice. Investing or trading in cryptocurrency assets carries inherent risks and can result in financial loss.


