
- Sphere Entertainment has recently broken the ascending triangle pattern on the downside.
- The SPHR stock price has surged for the 3rd consecutive trading session.
- Morgan Stanley has cut down the target price of the Sphere Entertainment stock.
The stock price of Sphere Entertainment has surged for the third consecutive trading session. It has jumped by about 5% or $1.68 in the previous trading session. It indicates that the bulls are still looking stronger even when the price has surged by about 14% in three sessions.
Sphere Entertainment’s stock price has shown great strength since the beginning of the year 2023. The stock price has recovered well from the lower level it made in December 2022. The stock price has changed the bearish structure to bullish in 2023. It is currently witnessing some selling pressure from the higher levels.


Morgan Stanley has adjusted the target price of the stock and reduced it from $26 to $24, a decline of 7% which is impactful. However, it has maintained the “equalweight” rating on the stock. The company is going to release the earnings results on 8th November 2023. It is expected that the company will report declined earnings for the third quarter of 2023. It seems like, the stock has already anticipated this much before the result.
Synopsis of the Sphere Entertainment
Sphere Entertainment has given a breakdown from the ascending triangle pattern on the daily chart and has reacted well after that. The Stock price has fallen and breached the previous swing low of $32.90. It has created a new swing low and taken support from the level of $31.05. However, this pattern is considered bullish and the price has given a breakdown on the downside.
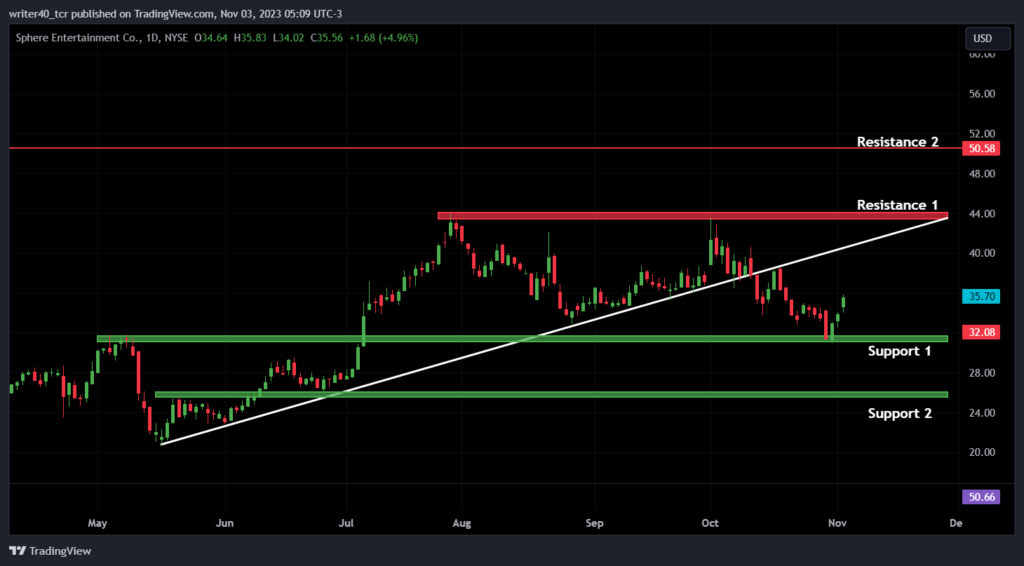
The stock price reacted positively from the support levels and it seems like the stock price has generated immense buying pressure from the lower level. Now the price is inching towards the resistance level of $43.75. However, if the price halts this upward move and breaches the support level of $31.05, it can move lower near the level of $26.12.
A Short Glimpse of the Indicator Used in the Technical Analysis
The SPHR stock price has been trading between 50-day and 200-day Exponential Moving Average. The stock price has recently challenged the buyers present near the 200-day EMA levels and the buyers have successfully defended the level. It indicates that the buyers are strong on the lower side.
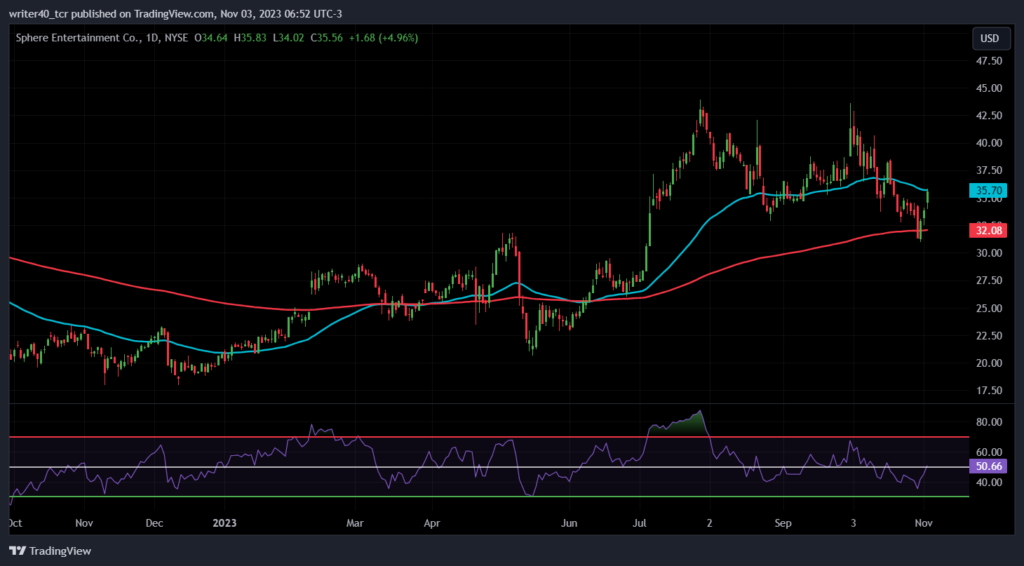
The relative strength index(RSI) is curving at 50.66, which indicates that the indicator is currently favoring none. However, the slope of the RSI is currently moving up, which signifies that the bulls are gaining momentum.
Conclusion
The SPHR stock price has shown a great surge from the 50-day EMA and the RSI has also started to favor bulls after the recent surge. The Earnings report is in line and it is expected to perform low in Q3 which can affect the stock price in a negative way.
Technical level
Resistance – $43.75 and $50.58
Support – $31.05 and $26.12
Disclaimer
The views and opinions stated by the author, or any people named in this article, are for informational purposes only. They do not establish financial, investment, or other advice. Investing in or trading crypto assets comes with a risk of financial loss.


