
- The all-time high price for the THETA crypto is $15.72.
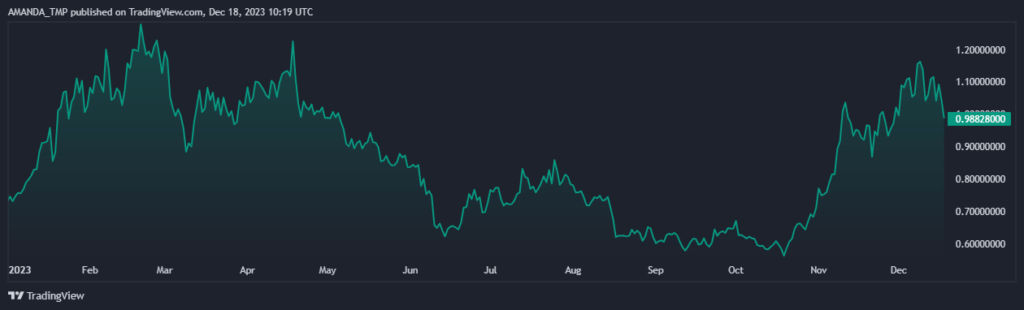
- In the past one year, the Theta Crypto has given a return of 30% to its investors.
Theta Network is a blockchain platform for video, media, and entertainment. It uses a multi-level BFT consensus, smart contracts, and a Metachain to enable scalable, decentralized, and low-cost content delivery. It has two tokens, THETA and TFUEL, for governance and operations and It also has an Edge Network for data storage, delivery, and DRM.
The market cap ranking of the THETA crypto is #63 as per CoinMarketCap. The market cap of the crypto has declined by 10.6% in the last 24 hours, resulting in $962.5M.


Theta Network has witnessed an advance of 62.6% in its trading volume in the last 24 hours. The circulating supply of the crypto is 1.0B THETA and the same amount of tokens in the total supply and max supply.
The fully diluted market cap of the Theta Network token is $959.089M. Also, the current market cap dominance of the crypto is 0.061% and the volume/market cap ratio of the crypto is 0.0198.
THETA Crypto Derivatives Analysis
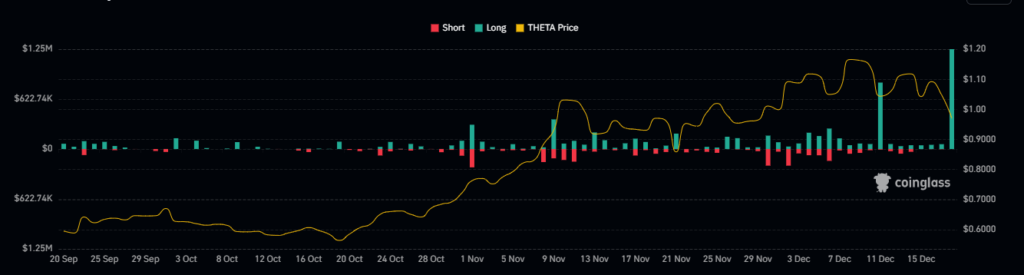
In the last 24 hours, the THETA crypto has a long/short ratio of 0.8727. Moreover, the trading volume of the crypto has advanced by 18.88%, resulting in $43.21M. Despite this, the open interest has declined by 7.5% and the long liquidation of the crypto is $195.85K.
THETA Crypto Technical Analysis
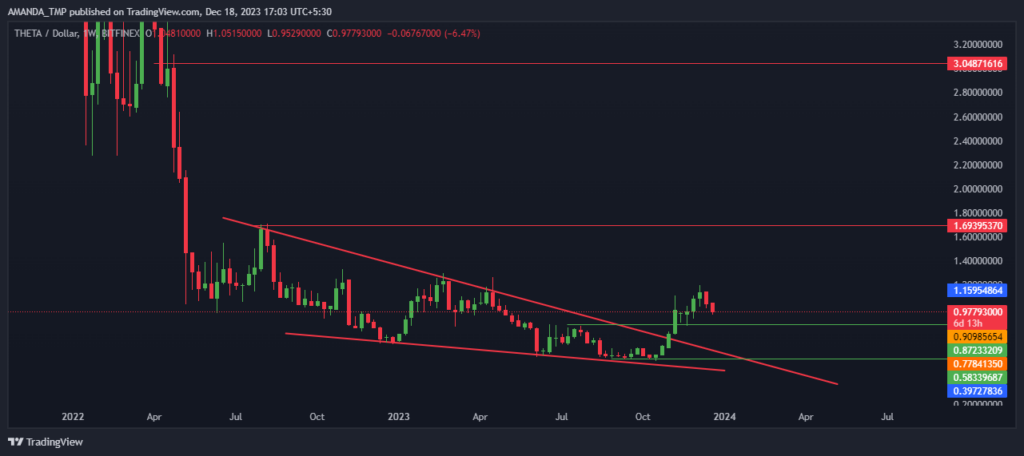
By consistently forming lower lows on the chart, the Theta Network price led to the formation of the descending triangle pattern. Moreover, the crypto’s trading price has broken above the pattern, witnessing the buyers’ dominance.
THETA/USD Chart by TradingView
The crypto price has declined below the median line of the Bollinger band, indicating profit booking in the market. Despite this, the crypto is trading above the 200-day EMA and unless the price sustains above the same, the uptrend might continue and advance to higher levels.
The MACD lines are trading in a bullish zone following a death cross of the MACD line and the signal line. This behavior of the indicator on the daily chart with the breakout on the weekly timeframe shows that the price of the crypto might be retracing.
Conclusion
THETA is a promising blockchain platform for video, media, and entertainment. It has broken out of a descending triangle pattern, indicating a bullish reversal. The crypto is trading above the 200-day EMA, which is a key support level. The MACD lines are bearish while trading in a bullish zone, suggesting more upside potential. THETA could target its previous highs or higher soon.
Technical Levels
- Support levels- $0.5833 and $0.8720
- Resistance levels- $1.6930 and $2.280
Disclaimer
The views and opinions stated by the author or any other person named in this article, are for informational purposes only and do not constitute financial, investment, or other advice. Investing in or trading crypto or stocks comes with a risk of financial loss.


