
- Technical analysis involves analyzing chart patterns and external factors to make future predictions about the market.
- Support and Resistance are the lower and upper levels of the market price.
- Technical analysis can be done using charts and technical indicators.
Traders and Investors need to guess the price fluctuations of their coin or asset to identify profitable trading opportunities, which includes selling a coin whose price is predicted to go down or buying the one whose price is predicted to go up.
Technical analysis refers to making future predictions based on the price and volume of assets. The basic belief behind technical analysis is that external factors like political events, natural calamities, and psychological notions affect the market price. These factors affect the current price of assets.


Assumptions in Technical Analysis
Technical analysis works on the basis of three assumptions which are:
Market and Discount: It is assumed that all the external factors have influence on the coin price, and that its current price already includes the influence from past factors, i.e. the current price is already discounted.
Price moves in trends: It is assumed that price always moves in a pattern or fashion. It is essential for the trader to identify the pattern and direction in which prices rise and fall in order to make correct predictions.
History repeats: It is assumed that the trading patterns and trends will repeat themselves and resemble past patterns. This is based on the assumption that market psychology is predictable.
The concepts of Support and Resistance
Support and Resistance are two fundamental ideas which are based on simple notions of supply and demand.
Let’s quickly refresh ourselves on how these two affect the price of a commodity;
If supply>demand, the price decreases.
If demand>supply, the price increases.
Support:
The level where the falling price of a coin stops and starts climbing back up is known as the support level. Support is the price point which attracts most buyers and this supply level has a price which is always below the market price.
Technical analysts believe that the price will almost always bounce back up from this support level.
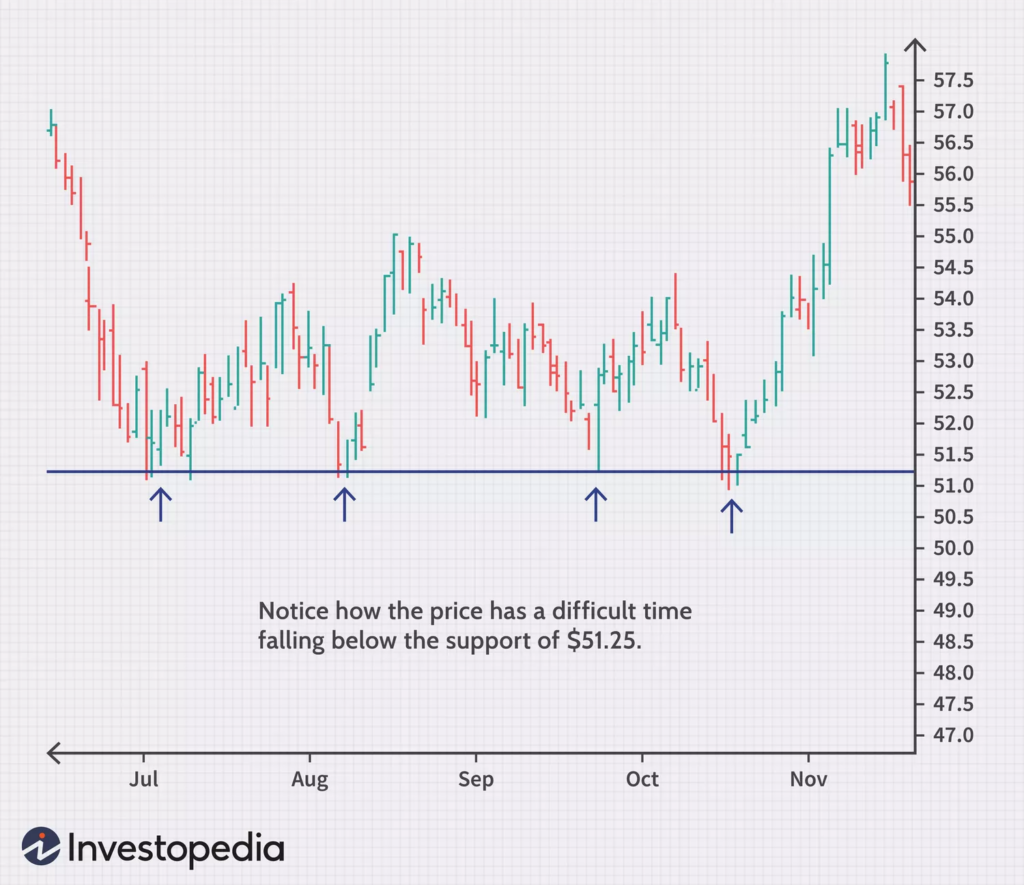
This graph clearly depicts a support level; $51.25 acts as the support for the falling price and multiple cases show that price always bounces after touching this level.
Many buyers will buy the coins at this level when it’s low and sell when it rises.
Resistance:
The level where the climbing price of a coin finally halts and starts to fall down is the resistance level. It refers to the upper limit of the market price. This price is always more than the market price. As we can guess, this is the price which attracts more sellers.
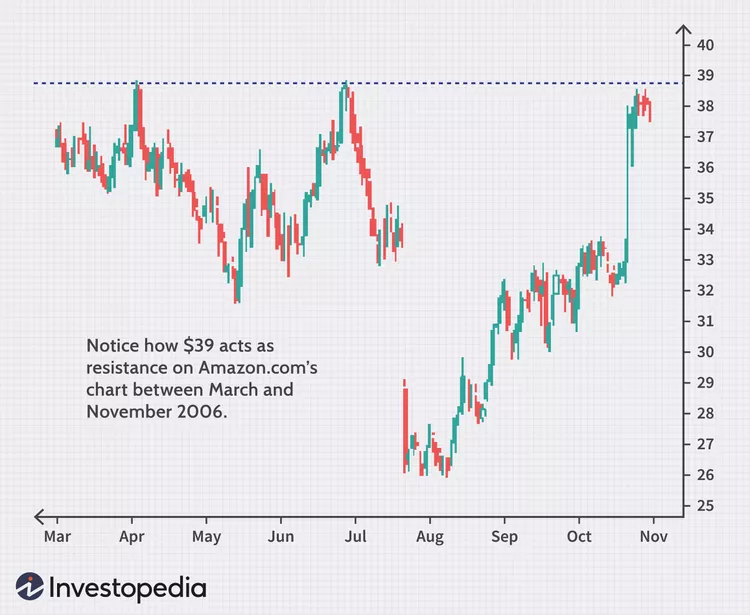
This graph clearly shows a resistance level. $39 acts as the resistance level and the price history demonstrates that the price falls after this level. Traders would want to sell the coins at this price so as to maximize their profits.
How to use Technical Analysis?
Charts:
Here the analysts briefly study the charts and try to identify patterns in them to get an idea of the support or resistance level. The analysts try to distinguish between an ascending and a descending triangle type.
Timeframes:
Next analysts may use different timeframes based on their personal trading style. The popular timeframes to analyze charts are:
| 5 minute chart | Day traders |
| 15 minute chart | Day traders |
| Hourly chart | Long traders |
| 4 hour chart | Long traders |
| Daily chart | Long traders |
Candlesticks:
This is a very common method among traders to visualize the price fluctuations in a time period.
The body of a candle shows the opening and closing price, whereas the highest and lowest point indicates the highest and lowest price in that time period.
Technical Indicators:
Here technical analysts use mathematics and statistics to identify signals which affect the market price. The most common technical indicators are:
Moving Averages, Bollinger Bands, Stochastic Oscillator, MACD, RSI, ADX.
Fundamental v/s Technical analysis
Fundamental analysis is a long term analysis, where the investors consider factors like a company’s financial statement, growth potential and underlying value of assets.
A technical analyst should be active and rapid in the buying and selling of his coins as per the market swings to in order to maximize his profits. They do not wait like fundamental analysts to keep the coin and wait for the price of the coin to go up again.
Critics often claim that the very assumption on which technical analysis stands, that history repeats itself, is not always true and that a trader may lose money if he simply follows past patterns. Furthermore, it revolves mainly around the price and volume rather than around giving inner insights regarding the market.


