
- ETH crypto price is currently trading in a descending channel pattern, starting from $4099.2.
- The current price hovers above the $2837.3 decisional bullish point of interest (POI).
- An increase of 28.32% has happened in the trading volume of Ethereum in the last 24 hours.
Launched on July 30, 2015, Ethereum (ETH) is a decentralized, open-source blockchain platform. It offers the execution of decentralized smart contracts and works as a platform for introducing numerous other cryptocurrencies.
The price of ETH crypto has been experiencing a correction phase since March 12, 2024. However, the bearish movement in crypto seems to be weakening in recent sessions. Let’s see the upcoming possibilities:


Will Bulls Regain Control Over the Ethereum Price? ETH Performance
On Feb 14, 2024, the ETH crypto price witnessed a positive response from buyers. The price gave a breakout of $2720.0, a crucial resistance level.
Subsequently, the buyers rallied the crypto price by over 50% from that resistance. It reached the $4099.2 major resistance level and started a bullish correction phase.
The investors and traders are currently dealing with this phase. According to the data from the last seven days, Ethereum is underperforming the global cryptocurrency market and similar cryptocurrencies like Bitcoin (BTC) and Solana (SOL).
However, Ethereum has still placed itself as 2nd most dominant cryptocurrency in terms of market cap.
Price Volatility & Social Dominance Analysis
The social dominance of the Ethereum crypto has experienced a fall after March 19. The fall resulted in the shift of bearish sentiments in the crypto on the psychological levels.
The price faced constant declines along with high volatility during significant price drops. However, the number of social tweets about ETH has been increasing since April 20, which can positively impact price rises.
Technical Analysis of the Ethereum (ETH/USD)
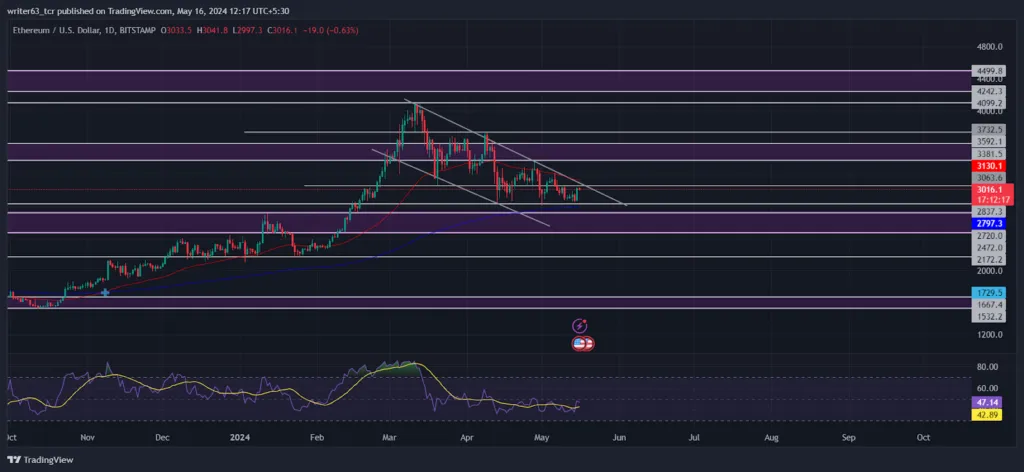
On a broader outlook, the key exponential moving averages (EMA) show a bullish trend. However, the current price is moving between the 50-day and 200-day EMAs, indicating an uncertain short-term trend.
ETH price is moving under a descending channel pattern from the $4099.2 resistance level. The current price sustains above the $2837.3 bullish POI. In recent sessions, the selling pressure seems to weaken while observing the candle formation. It reflects a sideways movement, indicating a bullish reversal at the current phase.
Furthermore, the relative strength index (RSI) has shown weak bearish momentum in the price. It indicates that the bears are losing grip on the ETH price in the current sessions. The RSI line is at 47.36 above the SMA line.
Summary
After Achieving the $4095.2 level Mark on March 12, the Ethereum crypto price has entered a correction phase. The price has been moving in a descending channel since then. Ethereum price has shown signs of weak bearish momentum in the recent sessions. The crypto holds a possibility of a potential bullish reversal at the current phase.
Technical Levels
ETH price immediate resistance stands at $3732.5 when writing, and the $2720.0 level is the next support. If the price breaks any of these mentioned levels, the price may move according to that direction.
Disclaimer
The views and opinions stated by the author or any people named in this article are for informational purposes only. They do not establish financial, investment, or any other advice. Investing in or trading crypto or stock comes with a risk of financial loss.


