
- The BONK crypto price has traded in green for 15 days in the last 30 days.
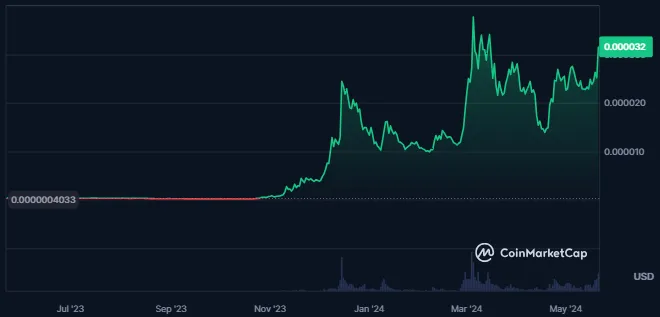
- In the previous 1 year, BONK has given huge returns of 7,893% to its investors.
BONK, created by Dexlab with support from Helio and Famous Fox Federation, is a community-focused cryptocurrency on Solana.
Launched in 2017, it serves as a governance token for decentralized decision-making, community rewards, and ecosystem development. BONK emphasizes decentralization, supporting NFTs, DeFi, and gaming within the Solana network.


When writing, the BONK crypto looked in a strong uptrend as its trading price advanced by 25% in the last 24 hours. Also, the crypto’s market cap was $2.012B, with a market cap ranking of #56.
The crypto’s liquidity is huge, resulting in a volume/market cap of 68.57%. It shows that it is very easy to enter and exit positions in the crypto as a large volume is traded in it.
What Does Derivatives Data Say About BONK Crypto?
The long/short ratio of the Bonk crypto is 1.0004, which shows buyers’ dominance in the derivatives of the crypto.
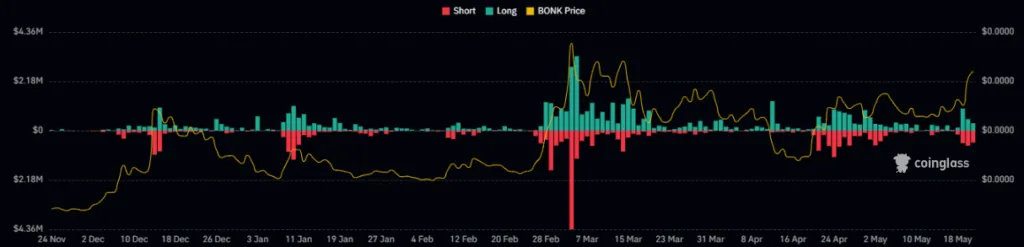
The long liquidation of the crypto in the last 24 hours from the press time is worth $550.63K. Despite this, the short liquidation for the crypto is $1.08M, which shows that a larger number of short positions have been liquidated in the last 24 hours.
The derivatives volume has also advanced by 48.13%, followed by a surge of 65% in the crypto’s open interest.
BONK Crypto Technical Analysis
The price of the BONK crypto is following a solid bullish momentum and is advancing to higher levels.
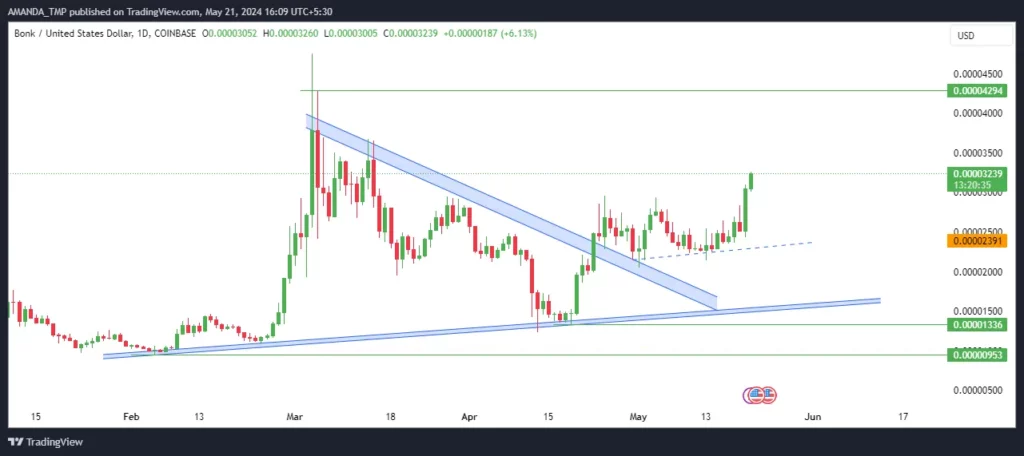
The price of the BONK crypto has led to the formation of a descending triangle pattern on the daily chart, and the price of the crypto has further broken out above the pattern.
The candlesticks further formed on the chart are strongly bullish, leading the price to higher levels.
BONK/USD Chart by TradingView
The price of the BONK crypto is advancing to a higher level by taking support at the 50-day EMA. The price has also advanced by 30% from the 50-day EMA, which shows strong momentum in the crypto price.
The MACD is strong on the charts as it gives a buy signal, followed by the MACD and the signal line trading in a bullish cross. Also, the following metrics have advanced above to the bullish trajectory.
The RSI is also advancing to higher levels and has hit the overbought zones. It has broken further above the 14-day SMA, which shows strong bullish momentum in the crypto price.
Summary
BONK, a community-focused cryptocurrency on Solana, has seen significant growth, with a 25% price surge in the last 24 hours and a 7,893% return over the past year.
With a $2.012B market cap, BONK’s bullish momentum is supported by strong technical indicators and high liquidity.
As the momentum of the crypto is strong, it might witness resistance at $0.0000420 and $0.000060 on the higher levels, while the support levels for the crypto are $0.000130 and $0.0000210.
Disclaimer
This article is for informational purposes only and does not provide any financial, investment, or other advice. The author or any people mentioned in this article are not responsible for any financial loss that may occur from investing in or trading. Please do your research before making any financial decisions.


