- Arbitrum is the 34th largest cryptocurrency in the global crypto market.
- The supply inflation of the ARB crypto is very high at 108.15%.
Arbitrum’s ARB token governs Arbitrum One and Arbitrum Nova, with the Arbitrum DAO and Security Council ensuring decentralized decision-making. The ARB token facilitates community-driven governance, distinct from ETH’s transactional role.
The market of the ARB cryptocurrency has advanced by 3% over the last 24 hours, after which the crypto’s trading volume has advanced by 104%. It shows the rising strength of the crypto uptrend.


The liquidity of the crypto is also huge, followed by a volume/market cap ratio of 25.86%. The market cap presence of the crypto is also strong, resulting in a market cap dominance of 0.13%.
The total amount raised by the Arbitrum crypto is $123.7M as per Defillama, and the value of the treasury of the crypto is $49.99M. Also, the stablecoins market cap of the crypto is $3.94B.
Arbitrum Crypto Derivatives Analysis
The crypto’s long and short liquidation are close, as per the data recorded over the last 24 hours from CoinGlass.
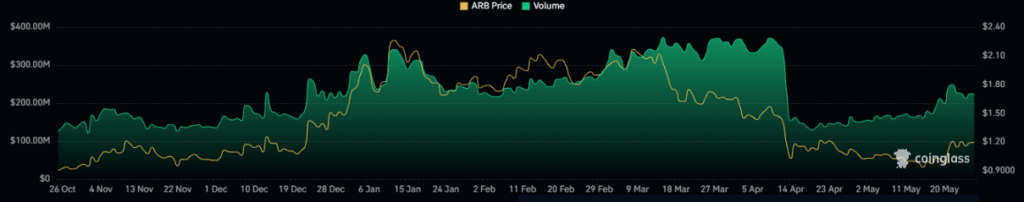
The derivatives trading volume of the crypto has also advanced by 100% in the last 24 hours, resulting in a traded value of $660.4M. Following this, the open interest in crypto has also advanced by 6.1%.
ARB Crypto Technical Analysis
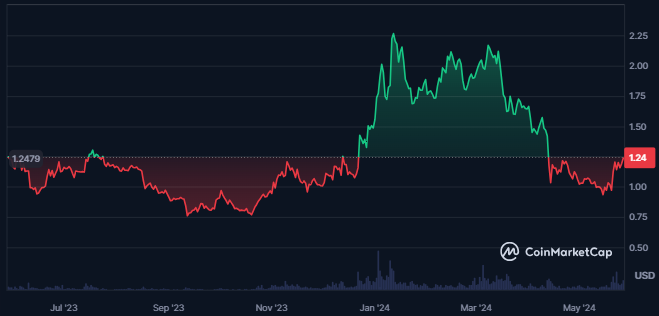
The overall chart of ARB crypto exhibits a strongly bearish trend, characterized by the formation of significant swing lows and consistent lower low swings. This downward momentum has been a defining feature of the price action over recent months.
In the most recent price movements observed last month, ARB has developed a falling wedge pattern, and its price also broke above the following pattern.
The breakout in the price shows a potential reversal in the trend. It also signifies a shift towards bullish momentum.
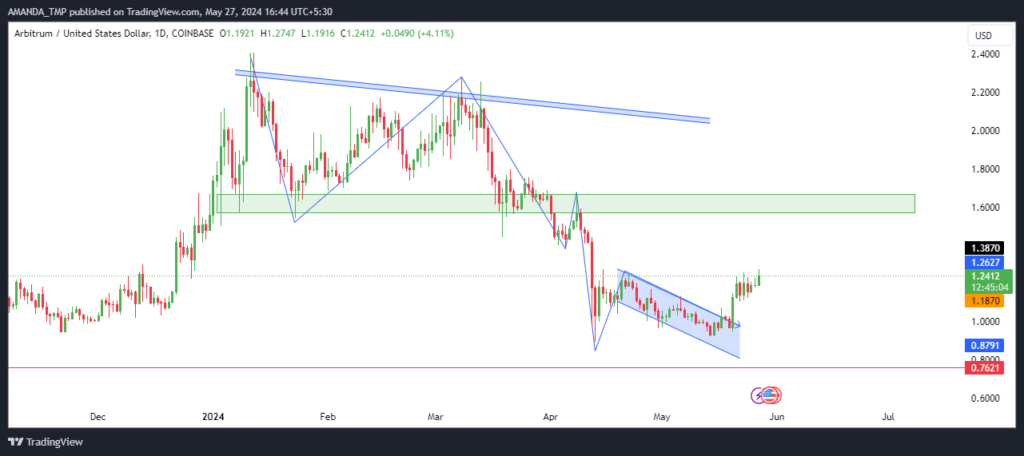
ARB/USD Chart by TradingView
The price of the ARB crypto has broken above the 50-day EMA, but the overall trend of the crypto is bearish as the 50-day and the 200-day EMAs are trading in a death cross.
The MACD looks to be getting bullish and heading towards the bullish trajectory, followed by the rise in the price. The histograms are also bullish.
The RSI further represents strong momentum in the trading price of the ARB crypto as the RSI has advanced to the level of 60.6 by breaking above the 14-day SMA.
Summary
Arbitrum, the 34th largest cryptocurrency, has shown strong bullish momentum following a breakout from a falling wedge pattern.
Trading volume surged by 104%, and the price broke above the 50-day EMA. Technical indicators like MACD and RSI also support a bullish outlook, signaling potential further upside for ARB.
The support levels for the ARB crypto are $0.760 and $0.930, followed by resistance levels of $1.5 and $2.18.
Disclaimer
This article is for informational purposes only and does not provide any financial, investment, or other advice. The author or any people mentioned in this article are not responsible for any financial loss that may occur from investing in or trading. Please do your research before making any financial decisions.


