
- The fear and greed index for Core DAO crypto indicates greed among investors.
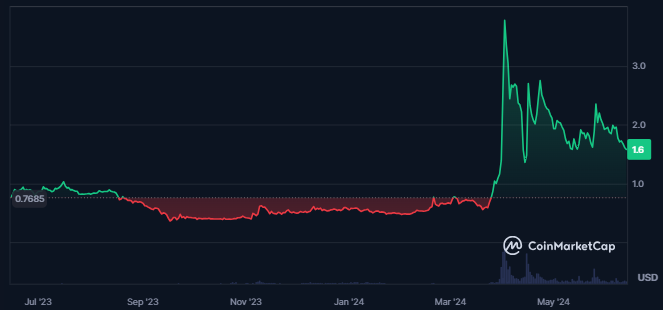
- The price of CORE has advanced by 100% in the last 1 year.
Core (CORE) is an L1 blockchain compatible with Ethereum’s EVM, running on the unique Satoshi Plus consensus mechanism, combining Bitcoin’s mining hash and DPoS.
Launched in January 2023, it aims to solve the blockchain trilemma and is governed by a DAO. Developer identities are undisclosed, but the project has significant support.


The market cap and the trading volume for the Core crypto declined over the last 24 hours. The market cap has declined by 6.3% while the volume of the crypto has declined by 8.4%.
The market cap ranking of the Core DAO is #64 as per CoinMarketCap and it is the 64th cryptocurrency in the global crypto market. Also, its market cap dominance is 0.06%.
Core DAO Crypto Derivatives Data Overview
The value of the derivatives trading volume of the Core DAO has witnessed a decline of 16.4% in the last 24 hours, witnessing a decline in the trading activity.
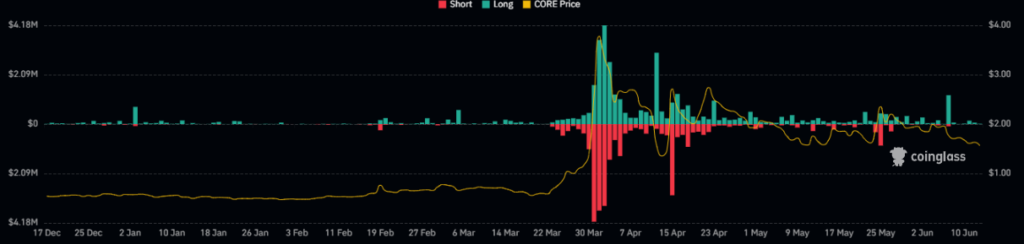
The long/short ratio of the Core DAO is 0.9077 followed by a huge long liquidation of $71.78K in just the last 24 hours. The open interest of the crypto has also further declined by 6.4%.
The liquidation chart of the crypto further shows higher long liquidations over time which shows that the sellers are ruling.
CORE Crypto Technical Analysis
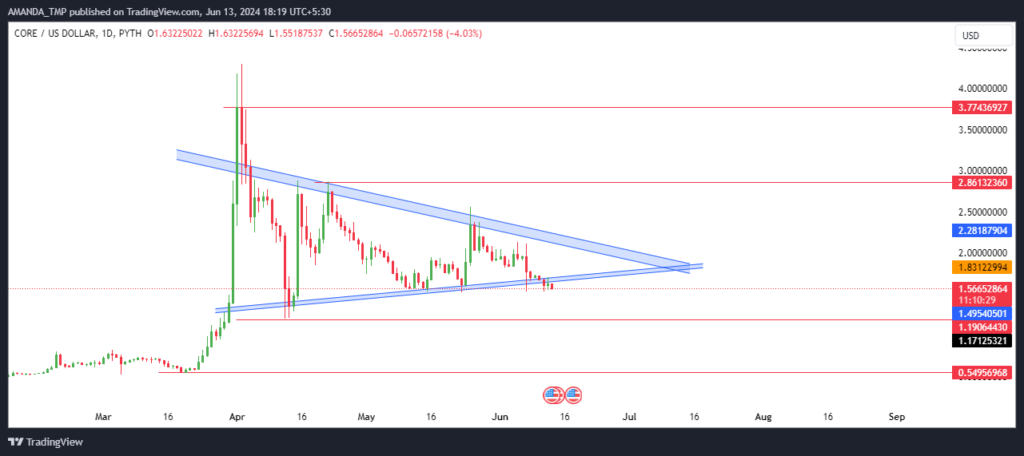
A symmetrical triangle is visible on the daily chart of CORE. Also, the price of the crypto has broken down below the same.
The price of CORE has achieved certain highs but is currently trading 75.8% below its all-time high price, which was achieved just a year ago.
The crypto has been consistently recording profits from the swing high of $4.2979 and has declined by 63% since then. Bears can be seen dominating as CORE has broken below the symmetric triangle pattern.
CORE/USD Chart by TradingView
The price of the crypto has declined below the 50-day EMA while the 50-day and the 200-day EMAs together are in a golden cross on the charts. Despite this, the declining behavior of price highlights weakness in the trend.
The MACD indicator is giving a strong sign of weakness as it declined below the zero level and its metrics are trading in a bearish cross.
At press time, the RSI had declined below the 50-level and the 14-day SMA on the daily chart and the value of the RSI was 38.85.
Summary
Core (CORE) crypto has broken below crucial support levels, indicating bearish sentiment. The market cap and trading volume have declined, with significant long liquidations. CORE is trading 75.8% below its all-time high, and technical indicators, including the MACD and RSI, show continued weakness and bearish dominance in the market.
The support levels for CORE crypto are $0.540 and $1.190 and the resistance levels for the crypto are $2.860 and $3.70.
Disclaimer
This article is for informational purposes only and does not provide any financial, investment, or other advice. The author or any people mentioned in this article are not responsible for any financial loss that may occur from investing in or trading. Please do your research before making any financial decisions.


