- The Solana price has lost around 15% in a week and has undergone a correction phase.
- Its trading volume has dropped by 30% in just a few hours.
In a wider time frame, the Solana price has been in a strong bullish trend, but sellers are leading the trend in the short term. The price has been rising by taking support from the trendline, and it has dropped back to the trendline.
At the beginning of May, the SOL crypto price took support on the trendline and tried to approach the last swing high. However, the sellers were strong enough and triggered a reversal from the $180 hurdle.


The chart shows that the SOL crypto price has defended last-swing lows. At the same time, the price has failed to develop a new swing high.
At press time, the SOL crypto price traded at $147.49 with a neutral momentum in the past 24 hours. The market capitalization is $68.06 Billion, and the 24-hour trading volume is $2.05 Billion. The circulating supply is 461,565,433 SOL, and the total supply is 578,168,884 SOL.
Will Solana Price Rebound or Trigger a Breakdown?
At the time of writing, the Solana price has slipped below the 20-day EMA and melted into the trendline. Sellers may become interested if the digital asset price starts trading below the trendline. Most investors might prefer to book profit at the breakdown, which may result in strong selling pressure.
Alternatively, a bullish candlestick pattern on the trendline may attract buyers. Buyers may be eyeing a swing high if the price exceeds the 20-day exponential moving average. Suppose the trading volume supports the buying momentum, it may gain bullish momentum in the long term.
According to the technical indicators, the Solana price has slipped below the 20-day EMA and is heading toward the 200-day EMA. The RSI is at 40 and has developed a bearish crossover with the RSI-based moving average.
Price vs. Volume Analysis
According to the given data, the trading volume has remained constant from the beginning of this month. However, the price has performed negatively. The SOL price is at the support level, and if the buying volume increases, the price may bounce back soon.
Performance
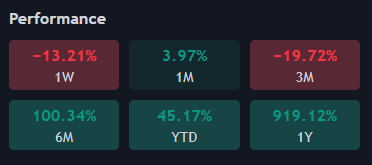
The Solana price has remained bullish for a year, gaining 919% and 45% YTD. The SOL crypto price has gone up by 100% in the past 6 months but has dropped by 19% in a month.
Conclusion
Based on the current market trends and technical indicators, Solana’s price appears to be facing some downward pressure in the short term. The price has slipped below the 20-day EMA and is approaching the 200-day EMA, indicating a bearish momentum.
The RSI has also shown a bearish crossover, suggesting a potential further downward movement. A bullish candlestick pattern on the trendline could attract buyers, and if the price exceeds the 20-day EMA with supporting trading volume, it may gain bullish momentum for the long term.
Technical Levels
The chart structure shows that the Solana crypto price is expected to face resistance from the $175 and $200 levels. It may take support on the $140 and $100 levels.
Disclaimer
This article is for informational purposes only and provides no financial, investment, or other advice. The author or any people mentioned in this article are not responsible for any financial loss that may occur from investing in or trading. Please do your research before making any financial decisions.


